How to Configure Integration Between Securden EPM and Azure Sentinel for Collecting Syslog Details?
To collect Syslog data sent from Securden EPM using Azure Sentinel, you need to configure your Azure portal and the Syslog server settings in Securden EPM. The steps have been split into four sections as shown below.
Part 1: Configuring Azure: Setting up a resource on Azure Portal in Log Analytics for collecting Syslog data
Part 2: Testing the resource after setting up Log Analytics
Part 3: Setting up a Securden Syslog Profile
Part 4: Setting up Azure Sentinel
Part 1: Configuring Azure: Setting up a resource on Azure Portal for collecting Syslog data
To collect Syslog data from Securden, you need to set up a resource in Azure that is assigned the task of connecting with the Securden server and collecting the Syslog data sent by the Securden Endpoint Privilege Manager server.
Note
If you already have a virtual machine set up to collect Syslog data through Log Analytics, you may safely skip parts 1 and 2. You may directly start at part 3 of this guide.
Follow the steps below to configure a resource in the Azure portal for Syslog data collection.
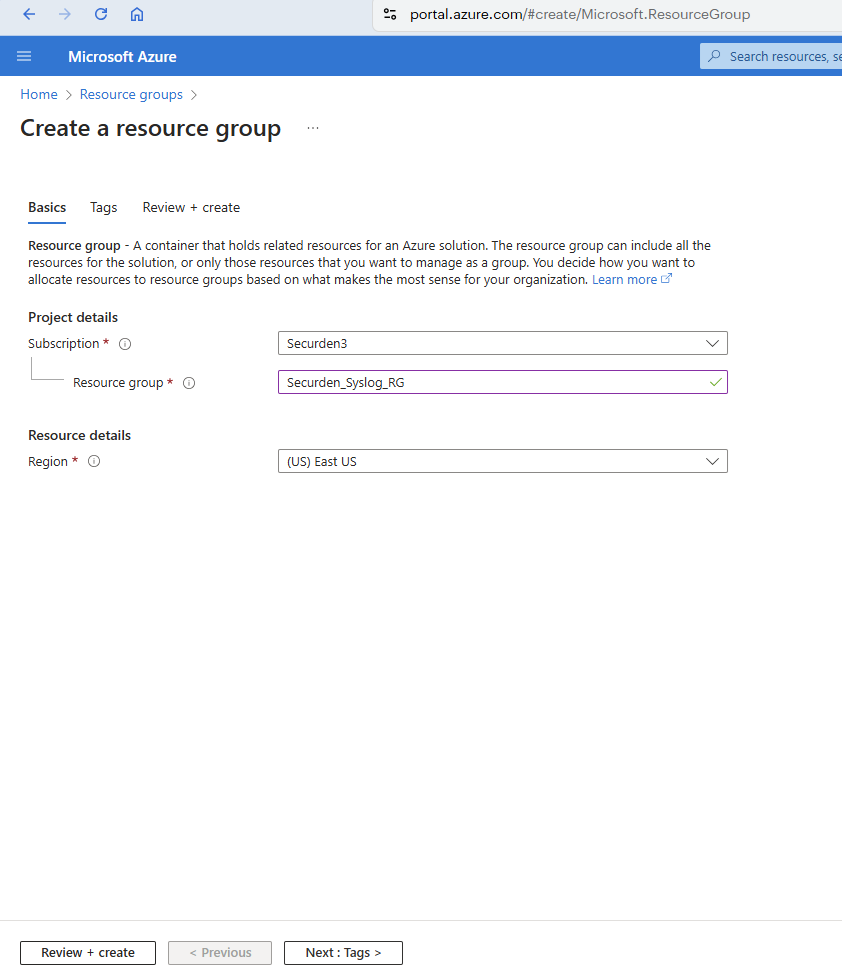
Step 1: Create a resource group
-
Go to the Azure Portal.
-
Select Resource Group and click Create.
-
In the window that opens, select the required subscription and provide a suitable name for the resource group along with the resource region details.
-
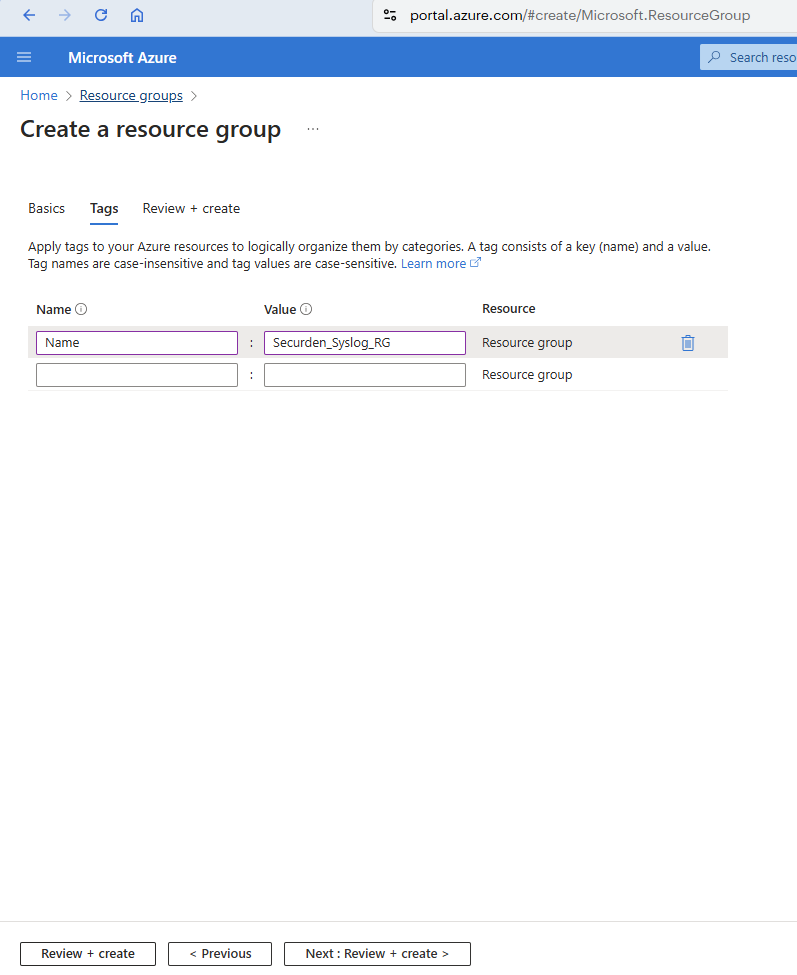
Click Next: Tags >.
-
In the window that opens, provide a suitable tag key and value as shown in the image below.
-
Click Next : Review + create >.
-
Review the summary of details and verify the details before finalizing the resource group attributes.
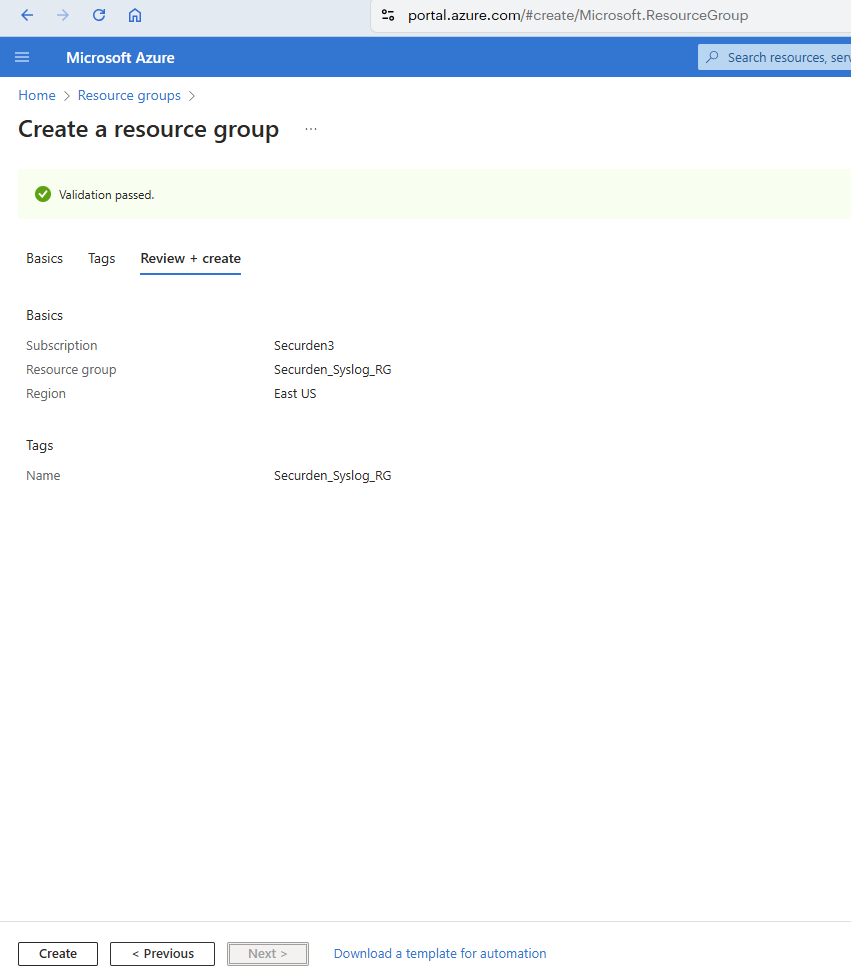
- Click Next to finalize the attributes and create the resource group.
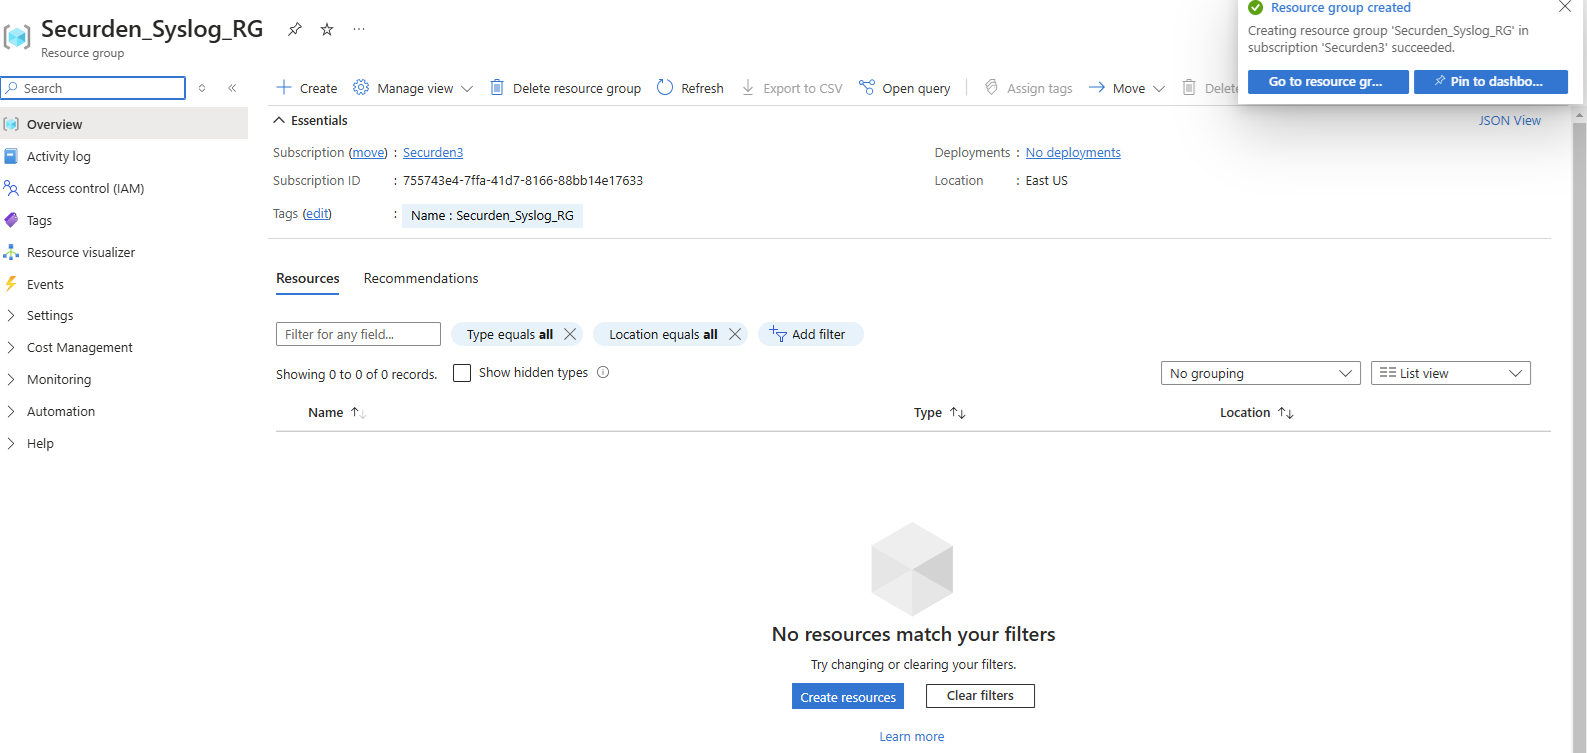
- Once you have created the resource group, you can proceed to the next step.
Step 2: Creating a log analytics workspace
-
In the Azure portal, search and select Log Analytics workspaces.
-
Select Add.
-
In the window that opens, select the subscription and resource group created in the previous step.
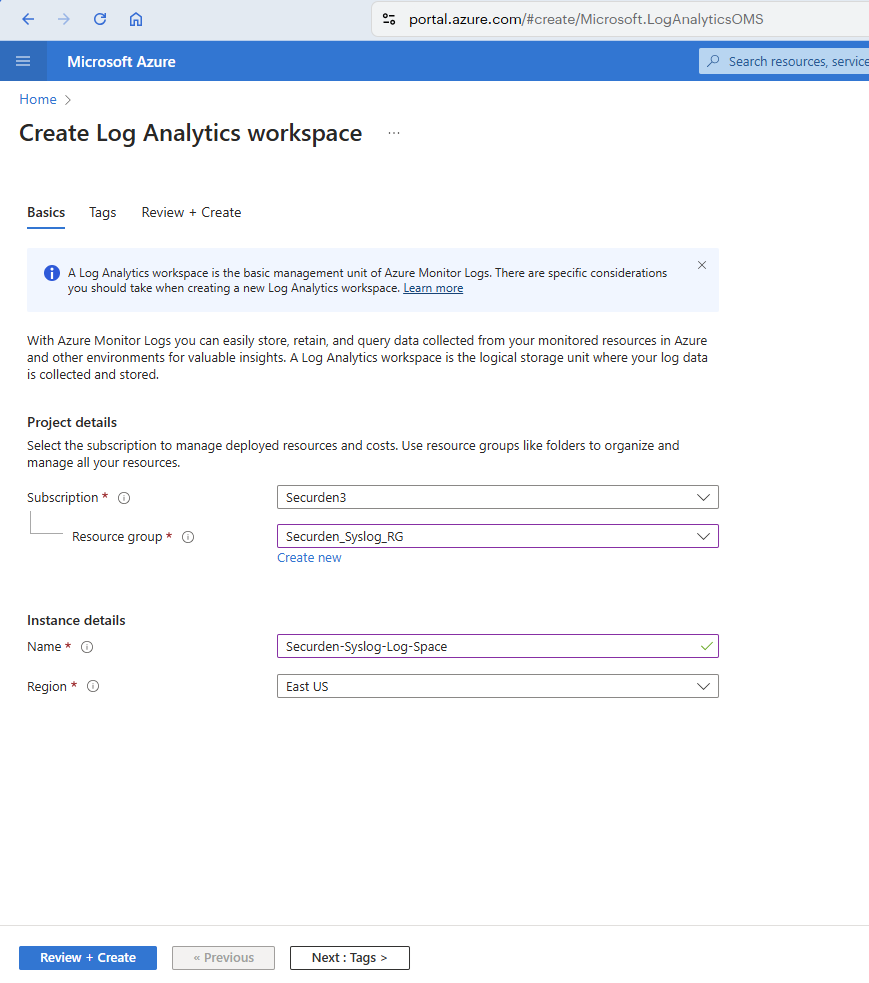
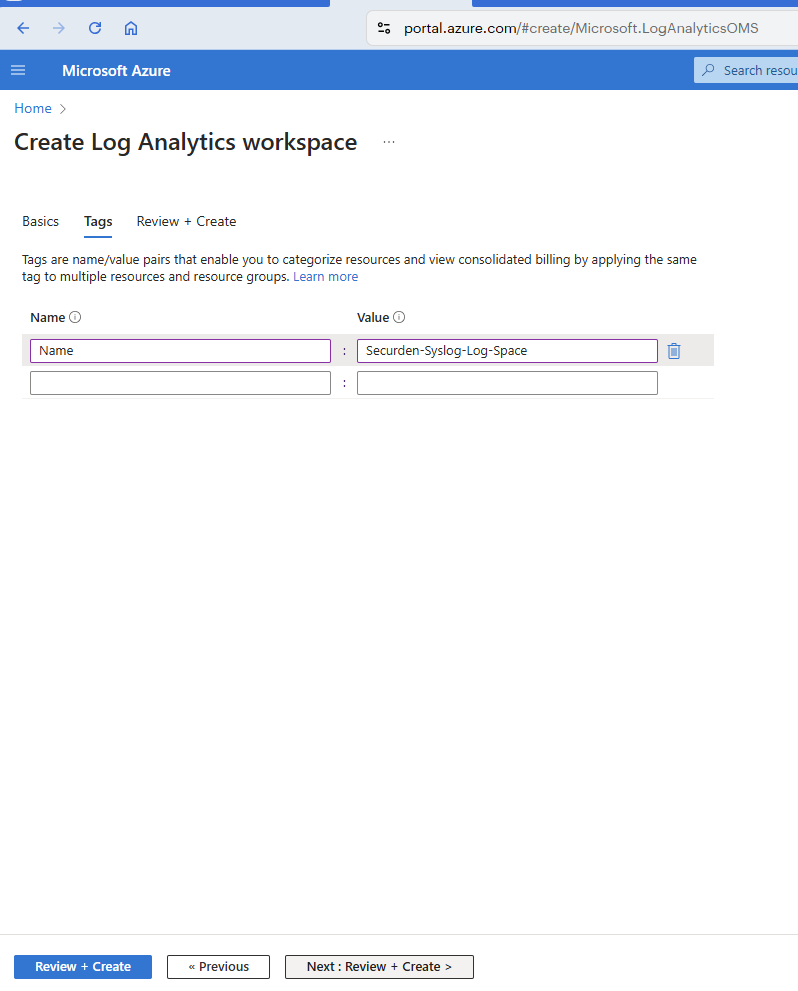
- Click Next : Tags > to add a suitable tag key(Name) and value for the workspace.
- Click on Review + Create to verify the attributes and create the log analytics workspace.
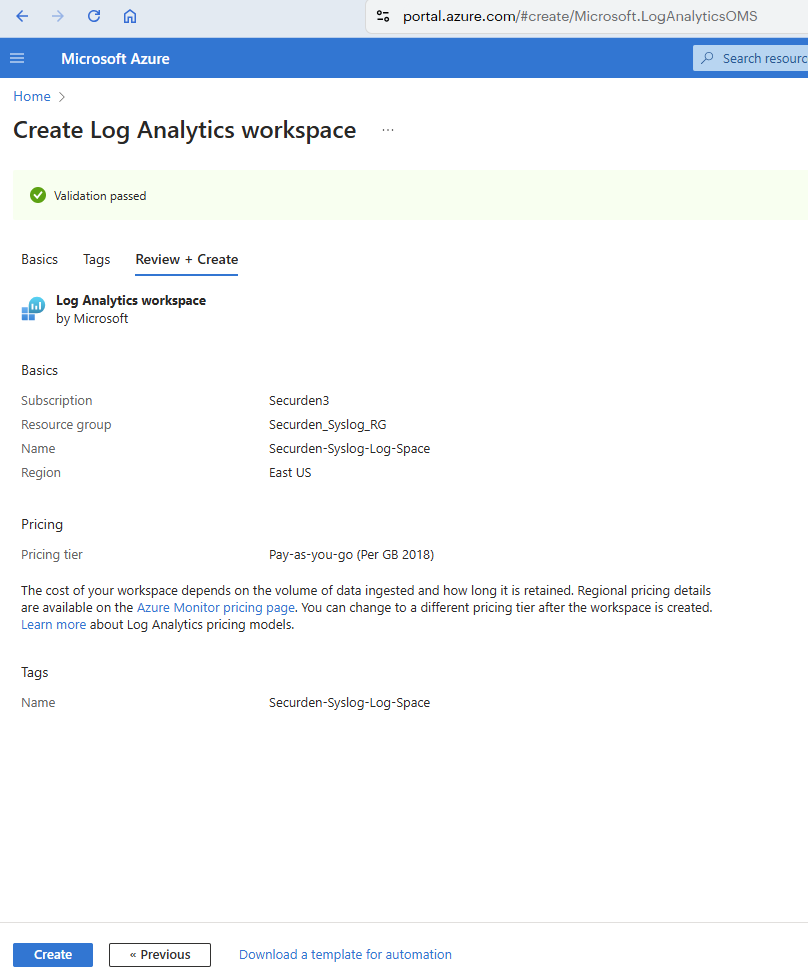
-
If you want to change any attribute, click on Previous and make the required changes. Once verified, click Create.
-
Once you click Create, the portal takes a few moments to set things up.
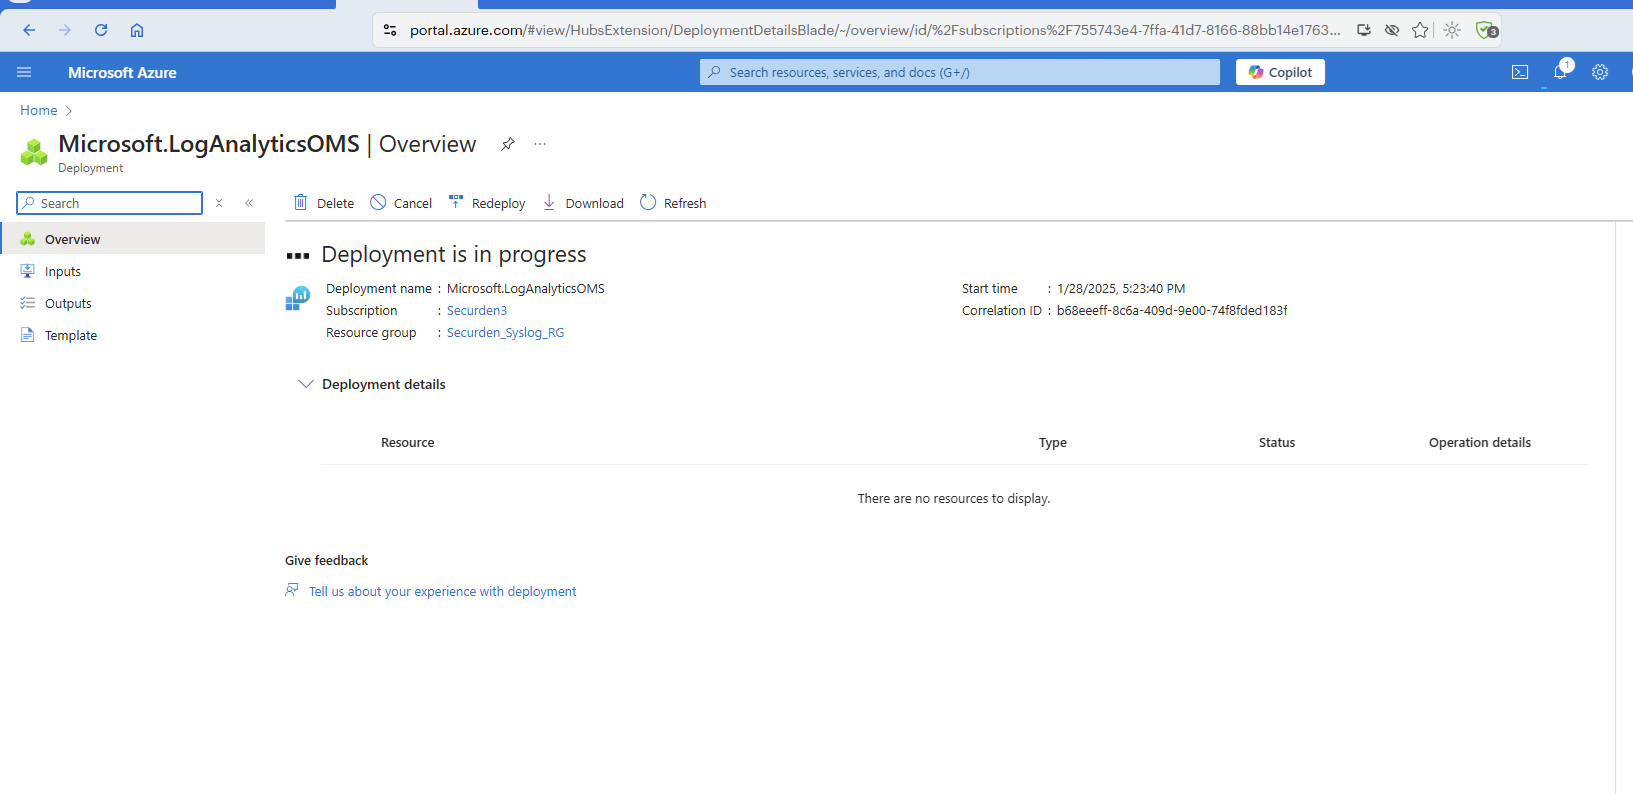
- Once the Log Analytics workspace is deployed, you will receive this confirmation window.
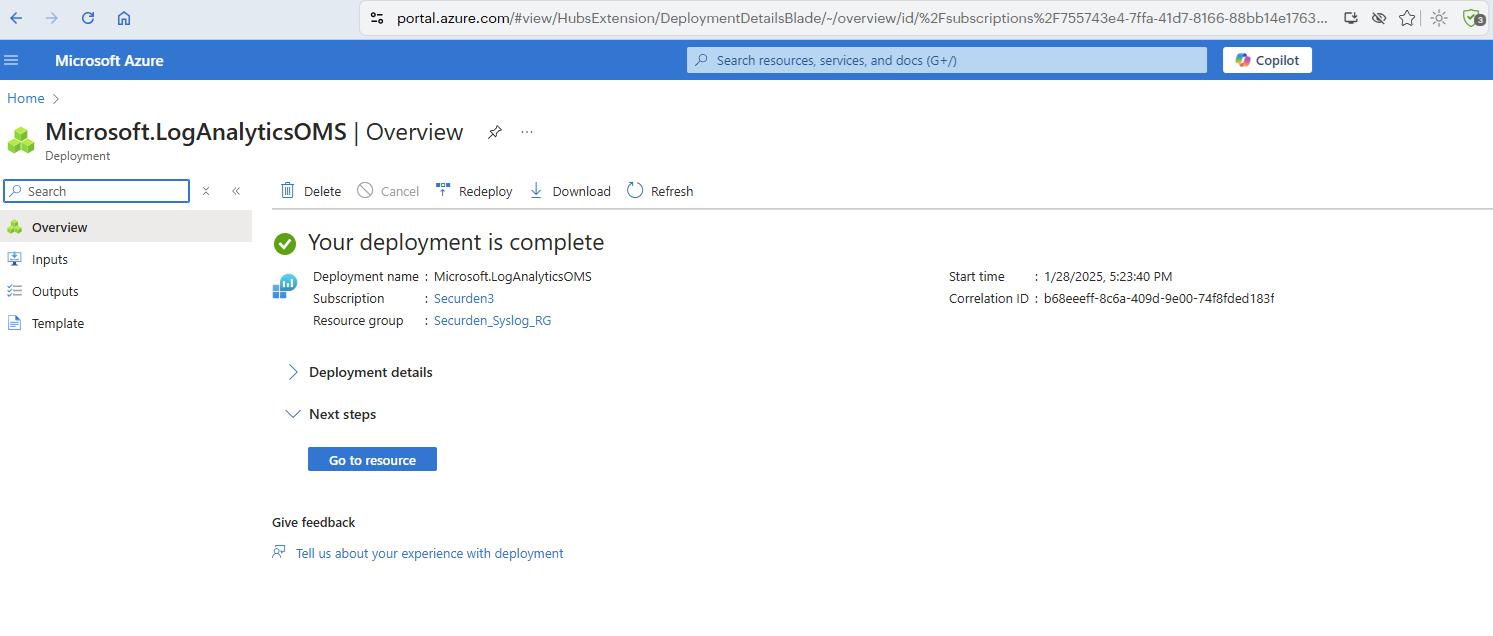
Once the workspace set up is successfully deployed, you can proceed to the next step.
Step 3: Creating a resource (virtual machine) for data collection
Once the workspace is deployed, you need to create an Azure Virtual Machine that will act as the data source for Log Analytics. Securden can send Syslog data to machines that it can connect with through the hostname or IP address.
Follow the steps below to create a virtual machine in the log analytics workspace.
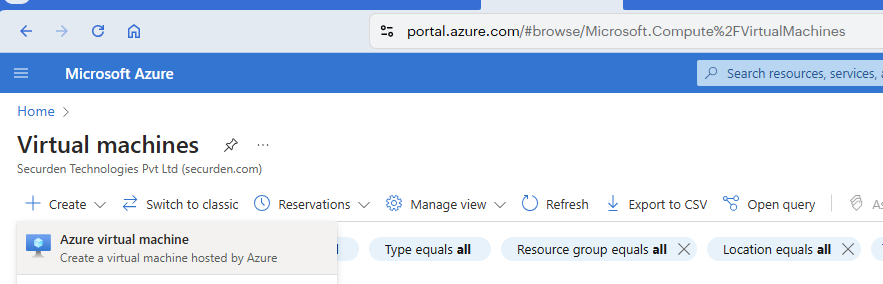
-
Search and open Virtual Machines using the search box in the Azure portal.
-
Click on Create and select Azure Virtual Machines.
- Create a virtual machine under the resource group created earlier. Provide a suitable username and password for the virtual machine.
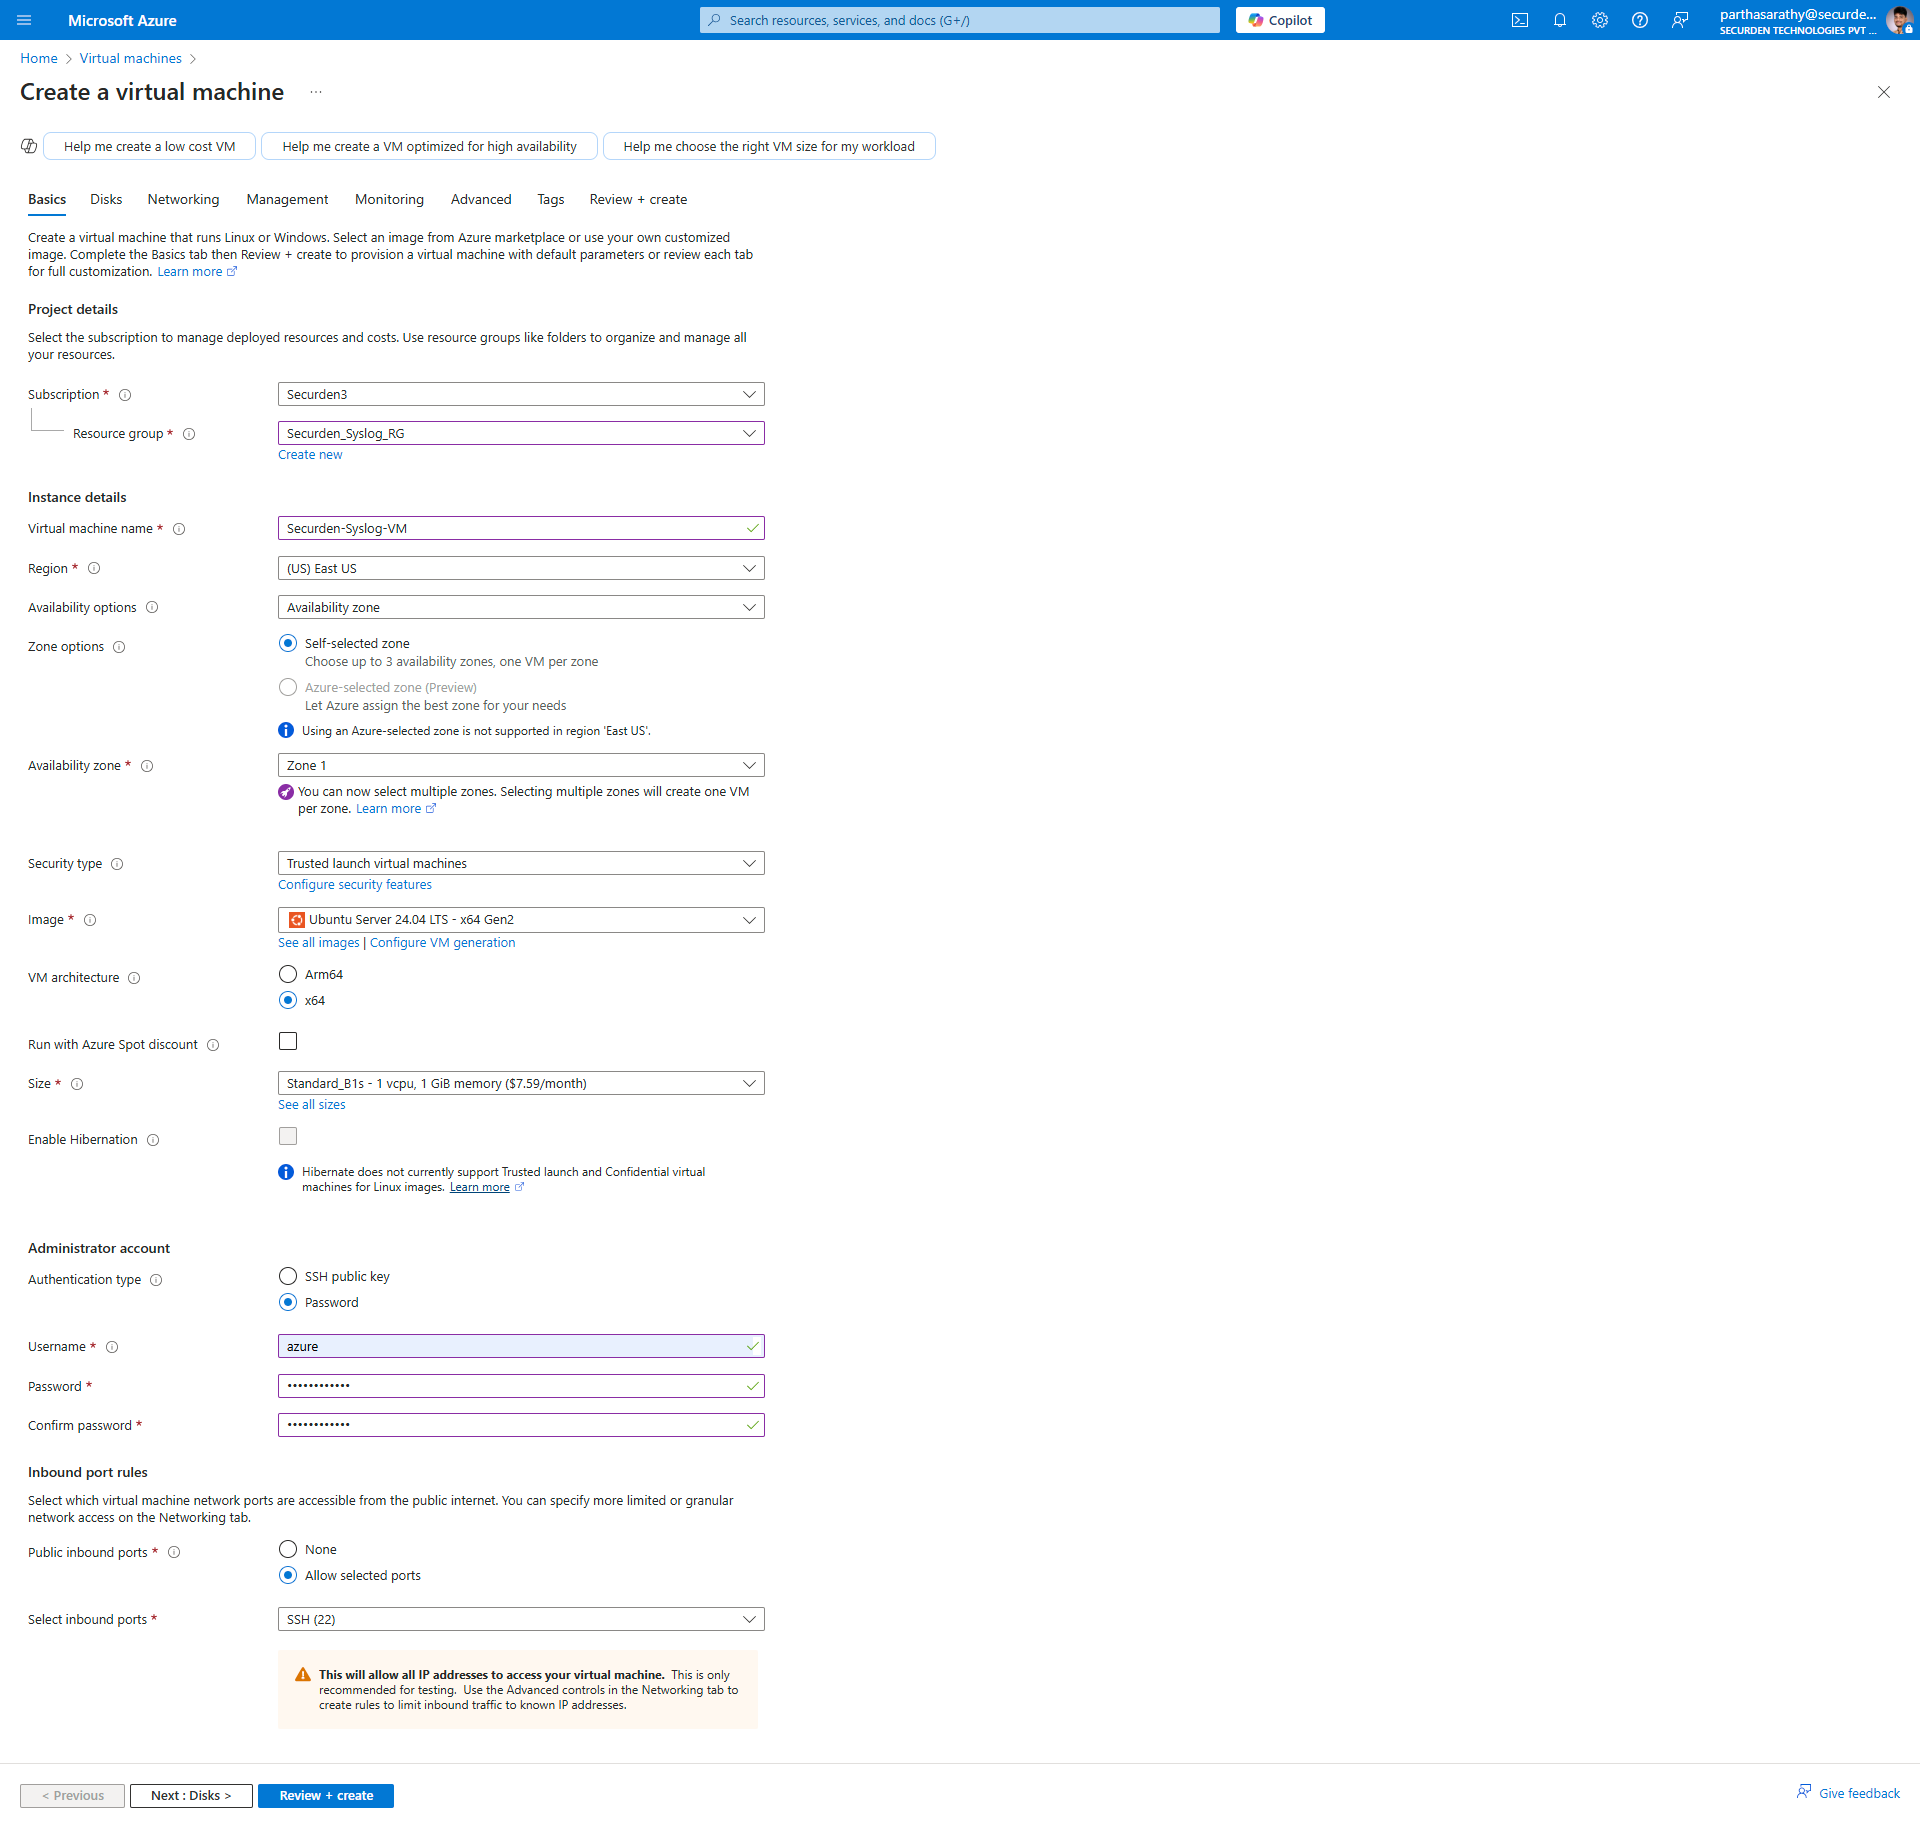
- In the next steps, you need to select a hard disk type (a HDD is perfectly suitable for Syslog collection) and configure a few other details. You can refer the image below for the parameters selected in these steps.
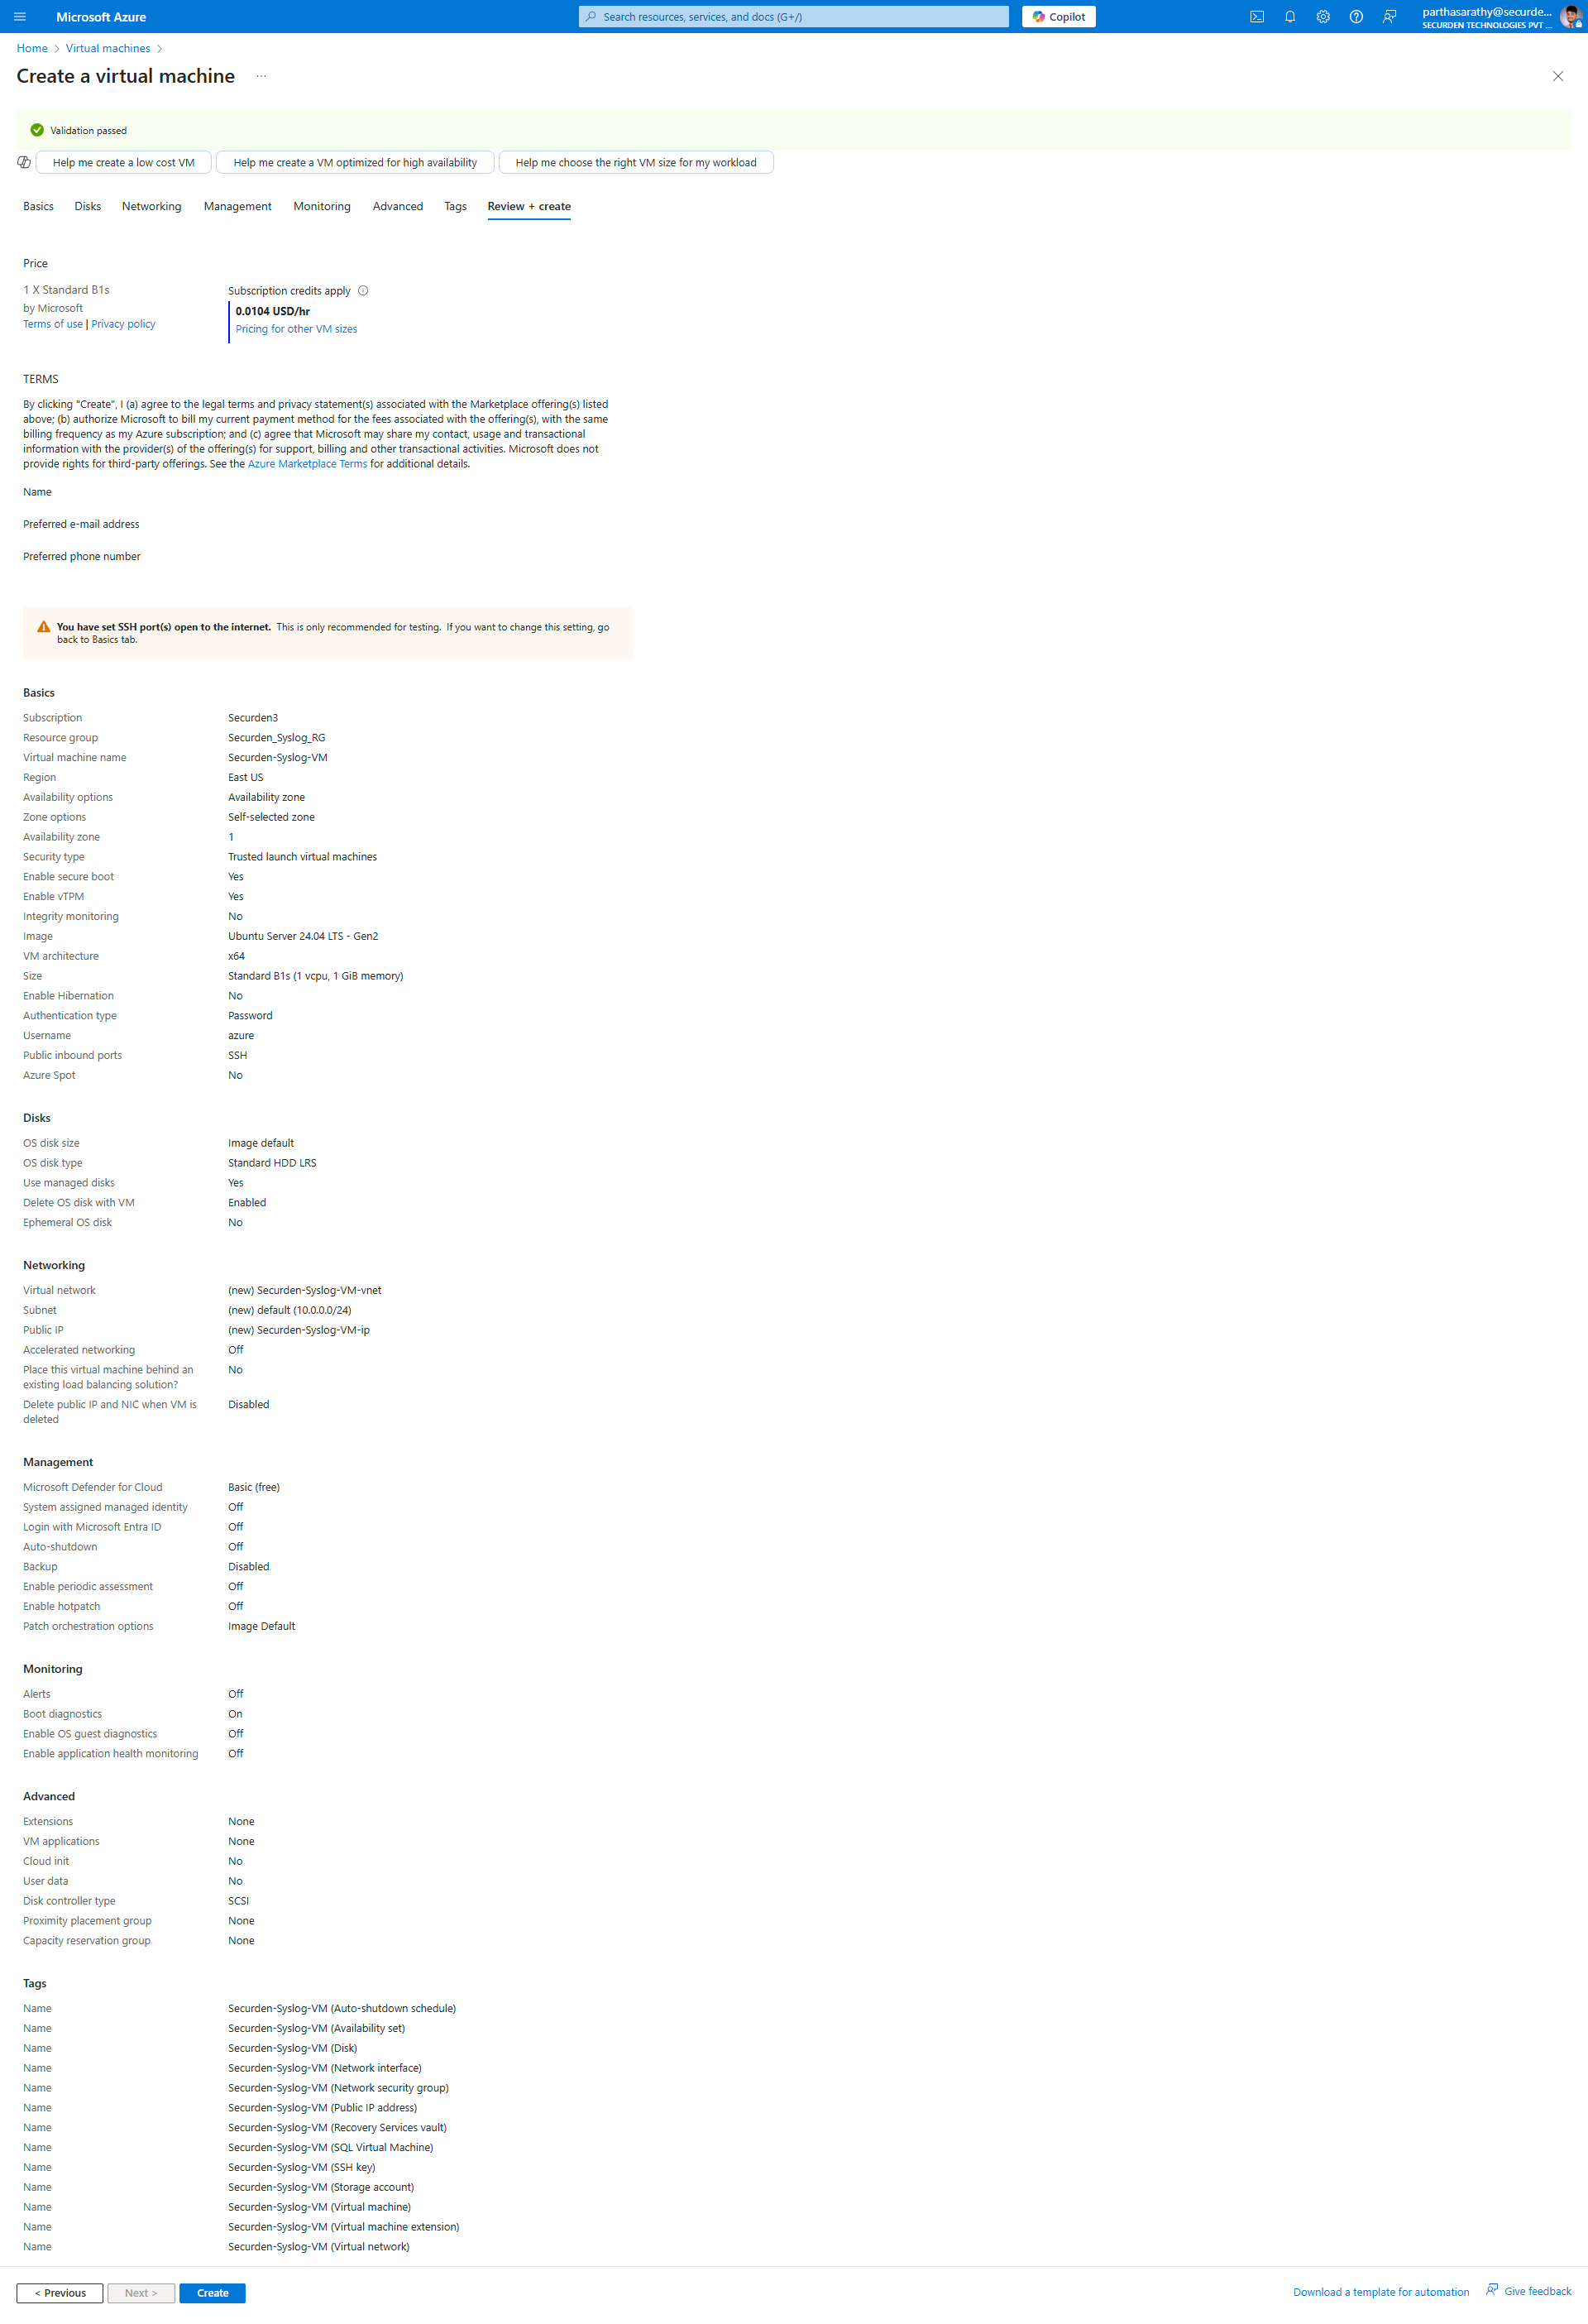
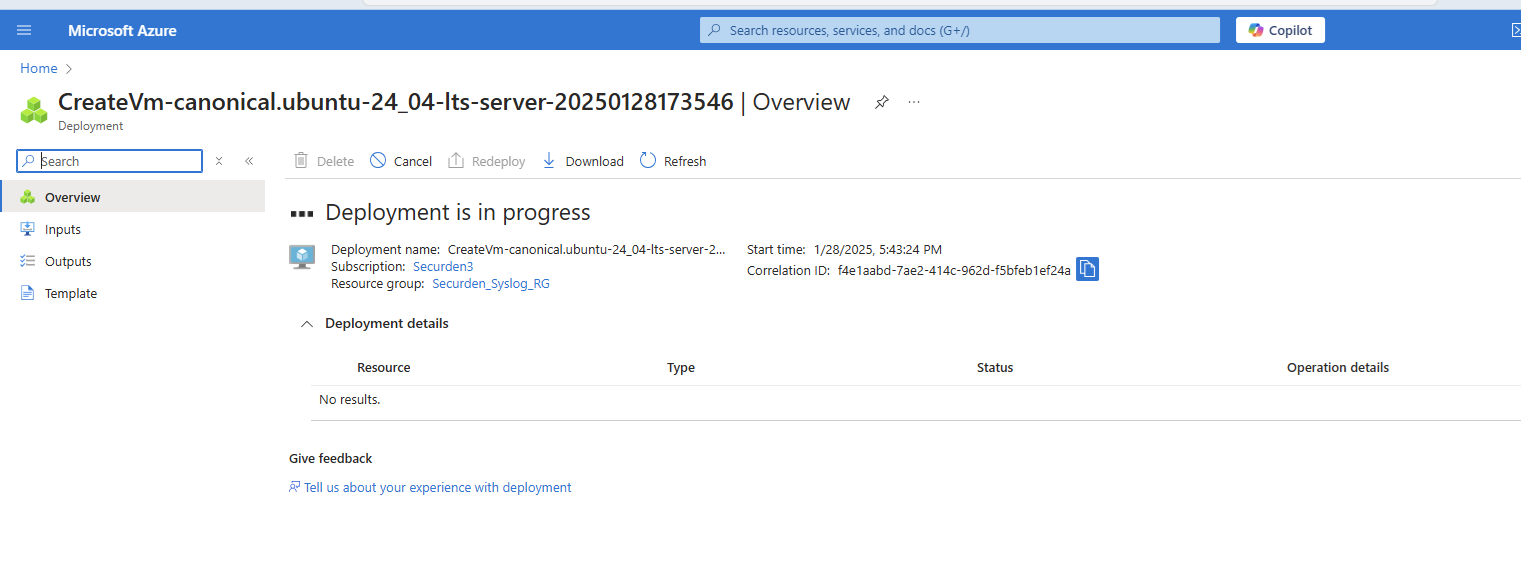
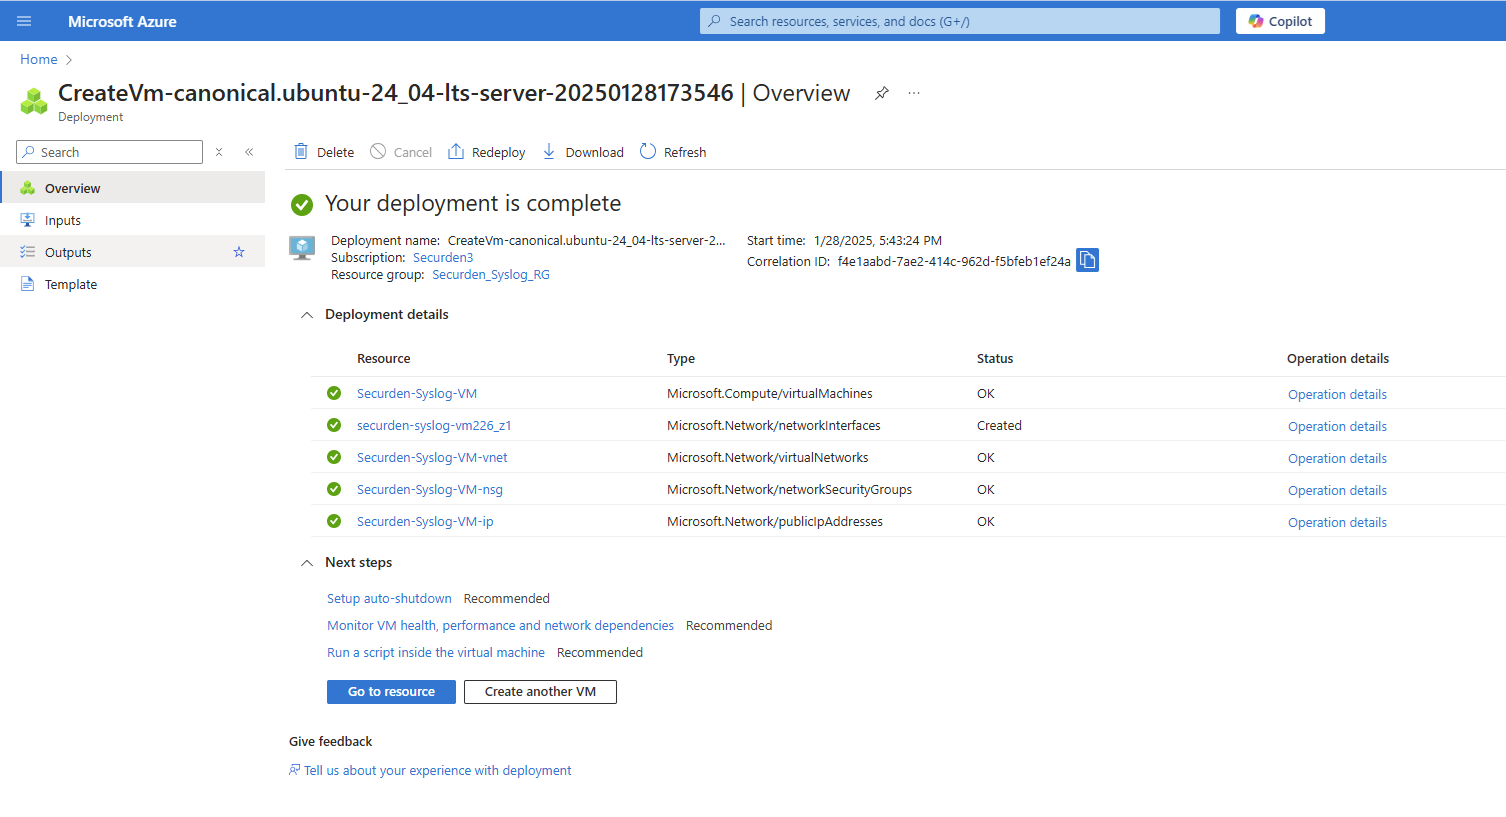
- Once the details are appropriately filled and reviewed, you can proceed to create the virtual machine. The deployment takes a few moments.
- Once the virtual machine is deployed, you can proceed to add inbound rules for the virtual machine.
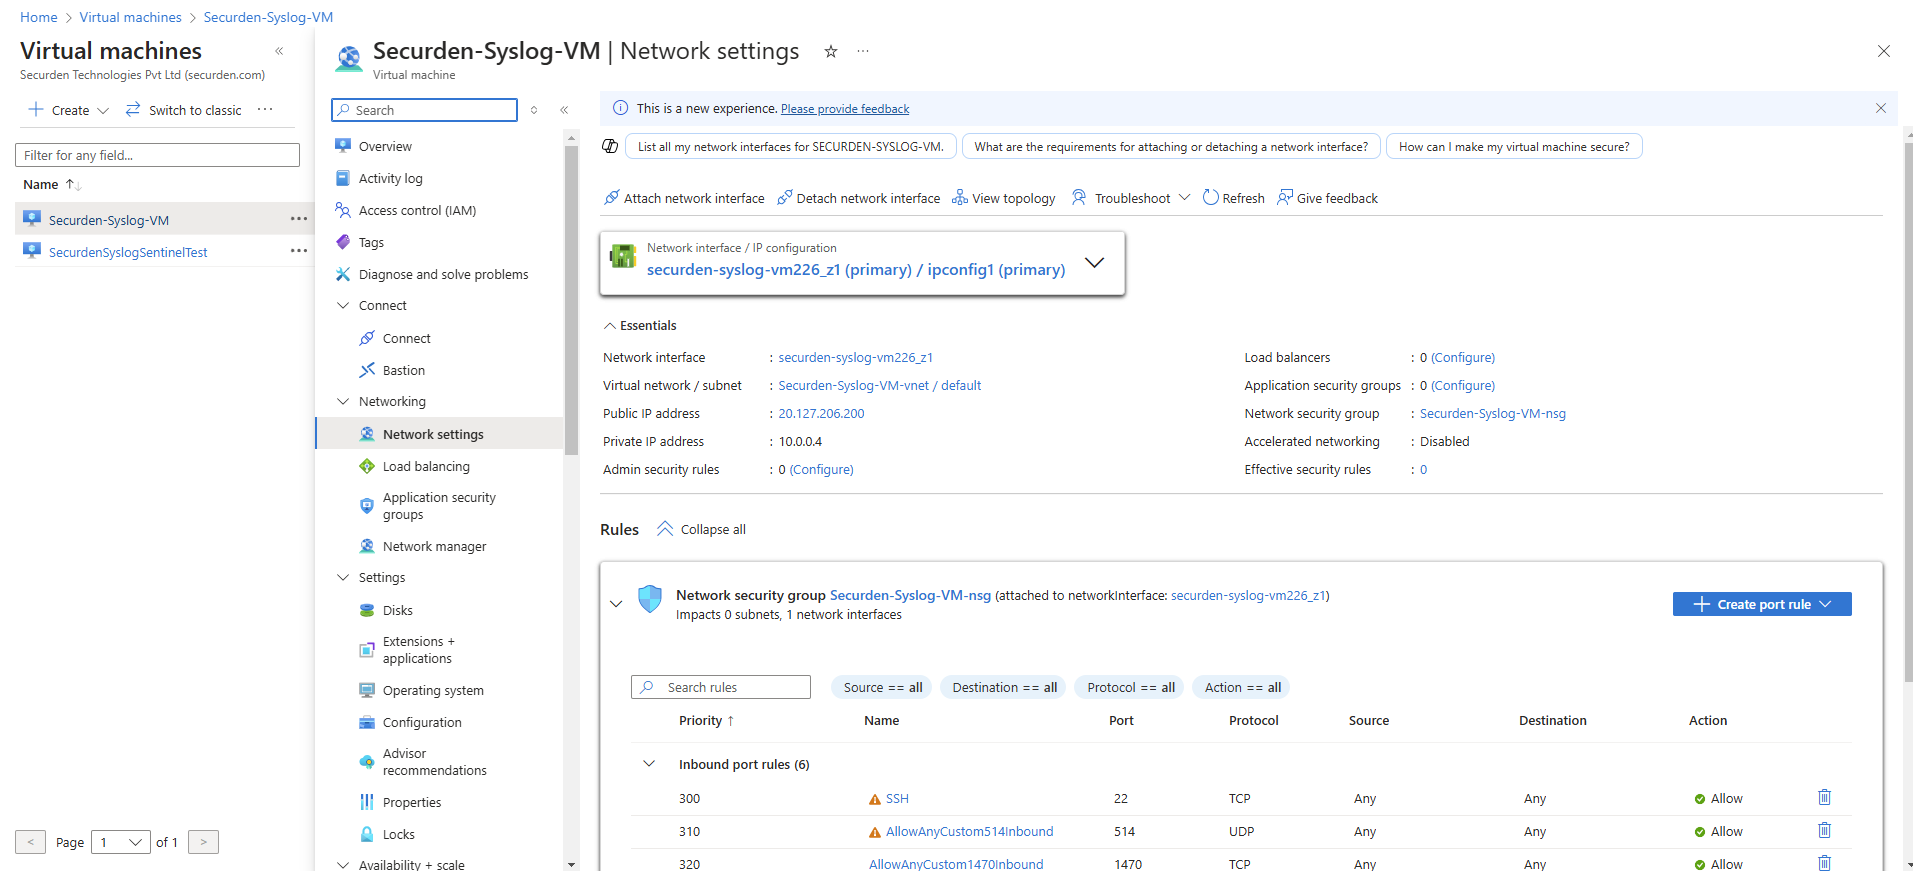
- To add an inbound rule, go to the virtual machine and then click on Network Settings.
Note
You have the option to collect data from Securden using Log Analyzer in two different formats, UDP and TCP. You can configure the inbound security rule according to your requirement
- To add an inbound security rule for collecting Syslog according to the TCP format, follow the table and image below.
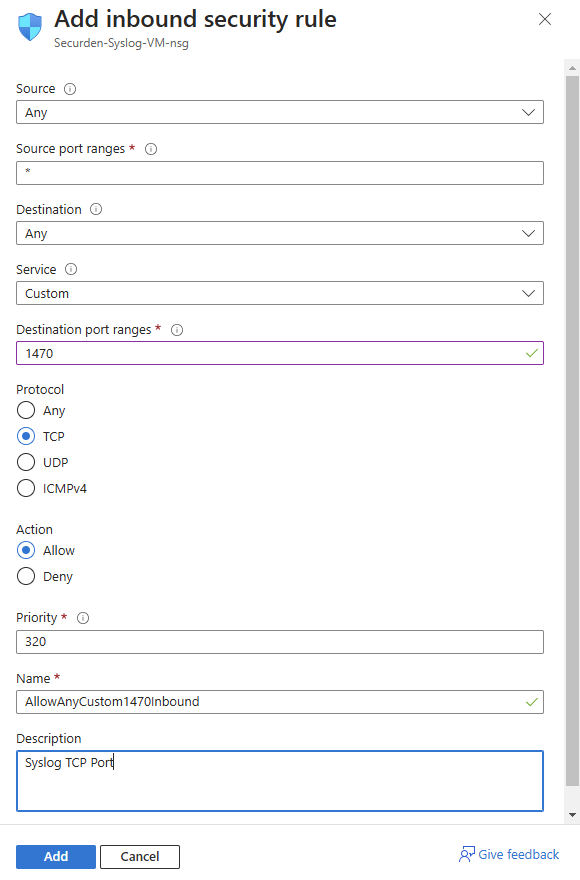
- Table for configuring inbound rule for TCP format:
| Field Name | Value |
|---|---|
| Source | Any |
| Source port ranges | * |
| Destination | Any |
| Service | Custom |
| Destination port ranges | 1470 |
| Protocol | TCP |
| Action | Allow |
| Priority | 320 |
- To add an inbound security rule for collecting Syslog according to the UDP format, follow the table and image below.
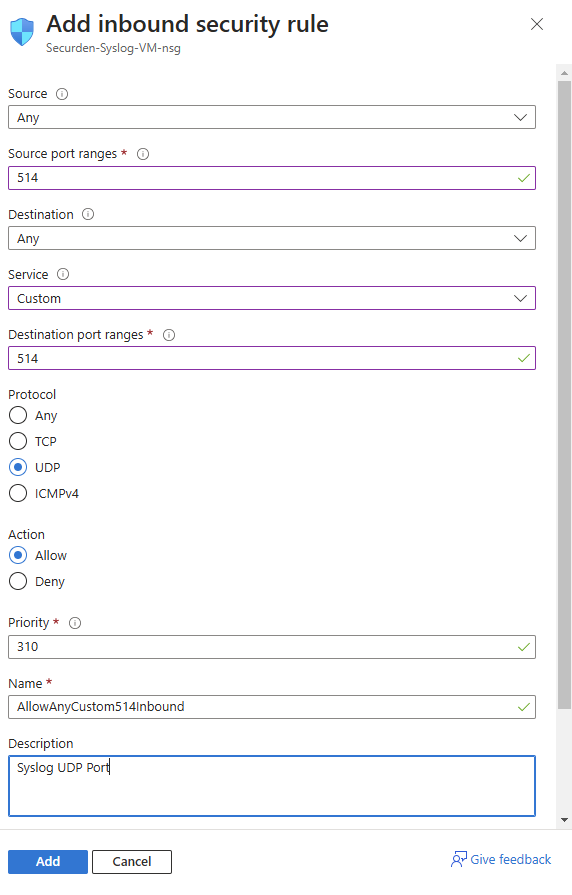
- Table for configuring inbound rule for UDP format:
| Field Name | Value |
|---|---|
| Source | Any |
| Source port ranges | 514 |
| Destination | Any |
| Service | Custom |
| Destination port ranges | 514 |
| Protocol | UDP |
| Action | Allow |
| Priority | 310 |
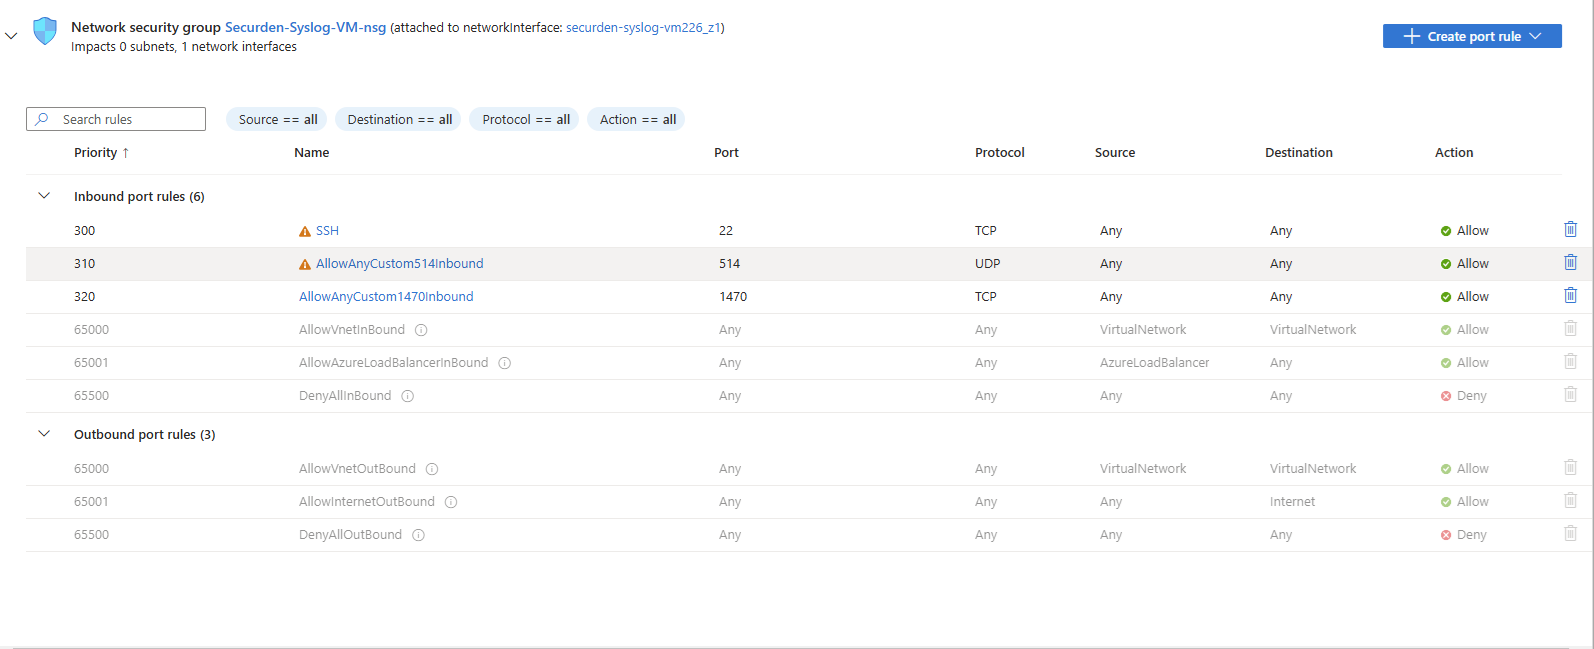
- Once the inbound security rules are added, they will be listed as shown in the image
Step 4: Creating Data Collection Rules for Azure Log Analytics
Once the virtual machine is set up and the inbound security rules for the preferred protocols are configured, you need to create data collection rules for the Azure log analytics workspace that was set up earlier.
Open the Log Analytics workspace.
Click on Azure Virtual Machine (VM) under Connect a data source.
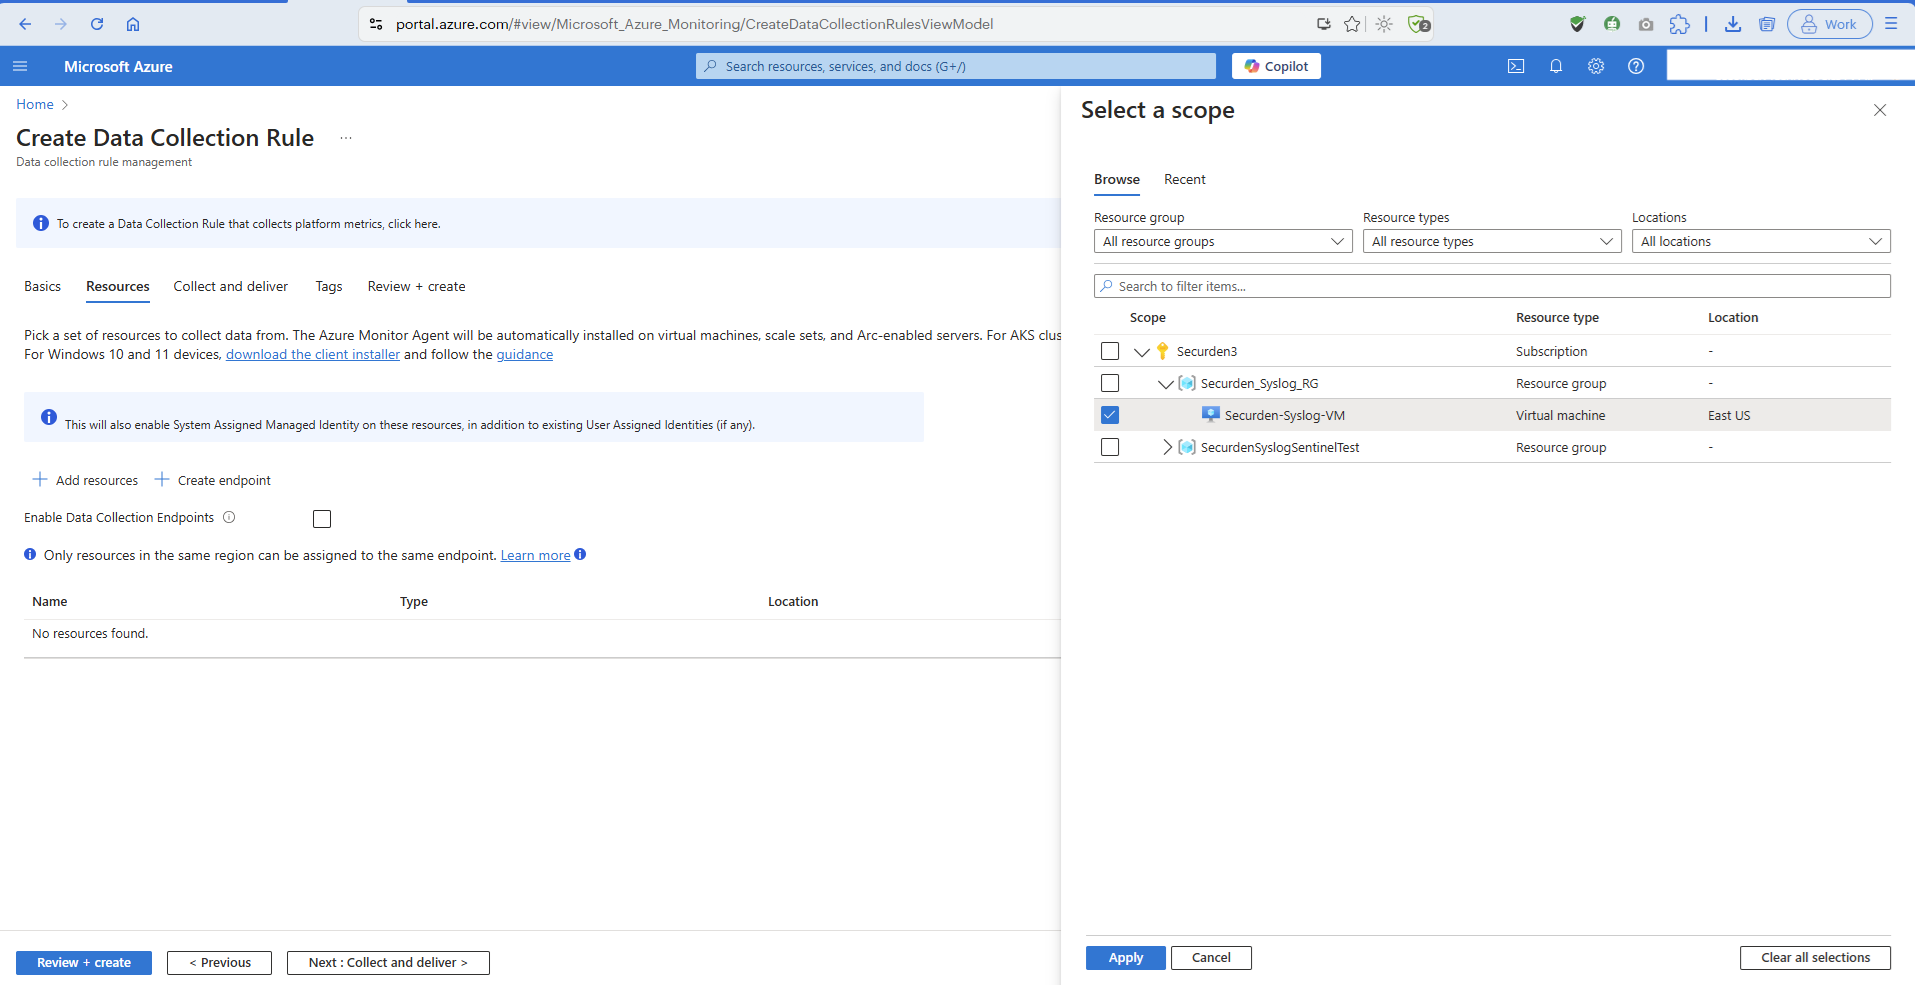
Select the virtual machine as the scope for the set of data collection rules that will be set up in the subsequent steps.
Once the scope is selected, click on Next : Collect and deliver >.
In this step, you need to specify the data source and destination.
Select the data source type as per the virtual machine configured in the earlier step. Since we have chosen a Linux based virtual machine, we will choose Linux Syslog as the data source type.
Once the data source is selected, we need to Set the minimum log level for the selected facilities. You need to select a log level equal to or lower than the level you select in Securden when configuring the Syslog profile. This will ensure every log sent from Securden will be captured by Azure log analytics.
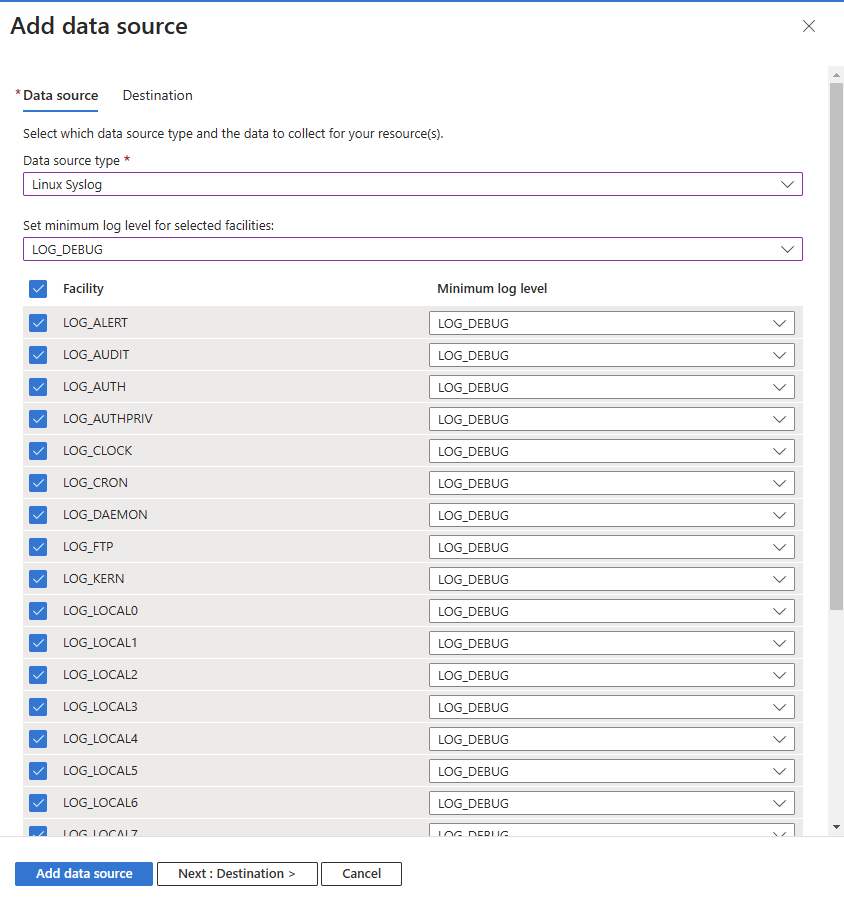
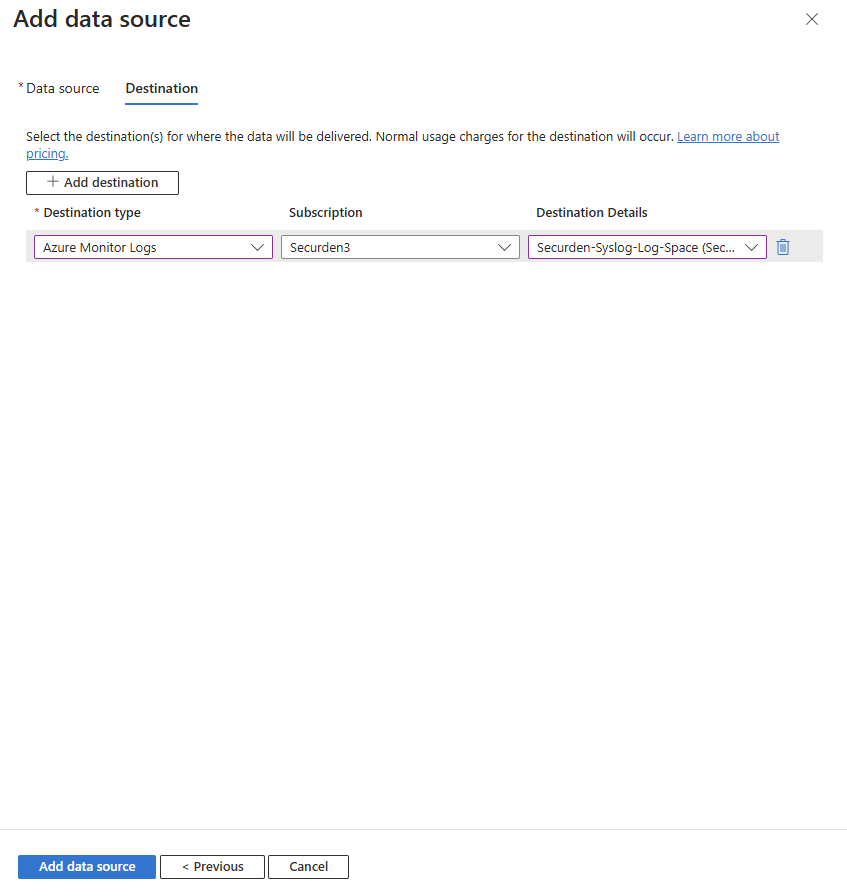
Click Next : Destination > to specify the destination of the logs collected.
Choose Azure Monitor Logs as the destination type. Choose the required subscription, and the log analytics workspace created earlier. Once done, click on Add data source.
Once the data source is added, you can click on Review + Create and proceed to review the attributes and create the data collection rules. Optionally, you can add tags to the data collection rule.
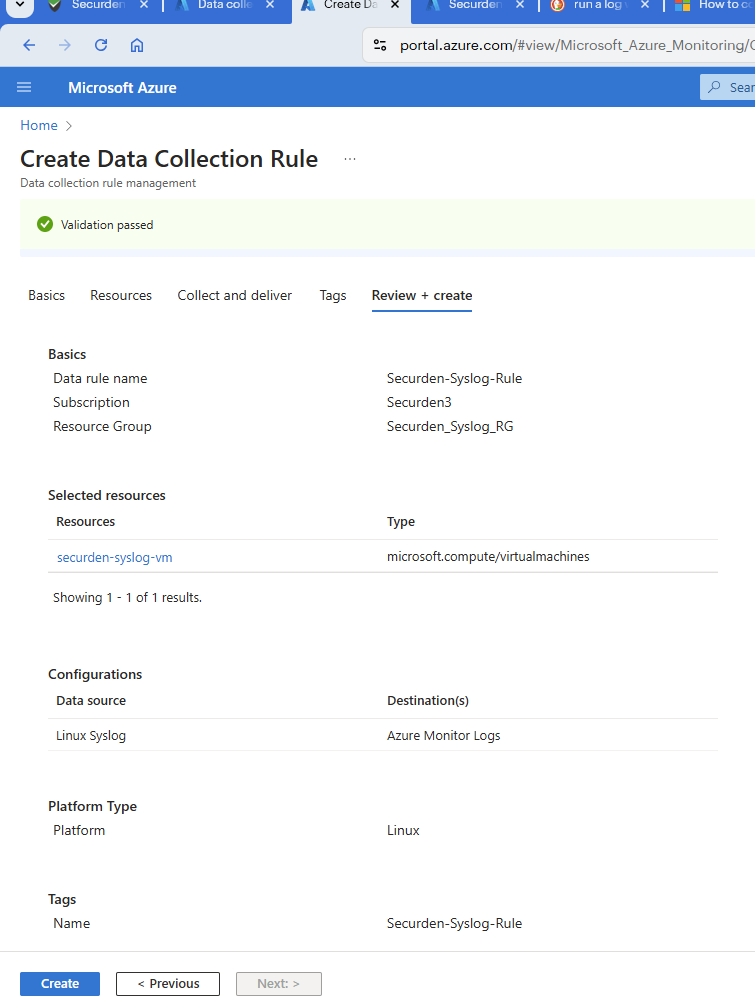
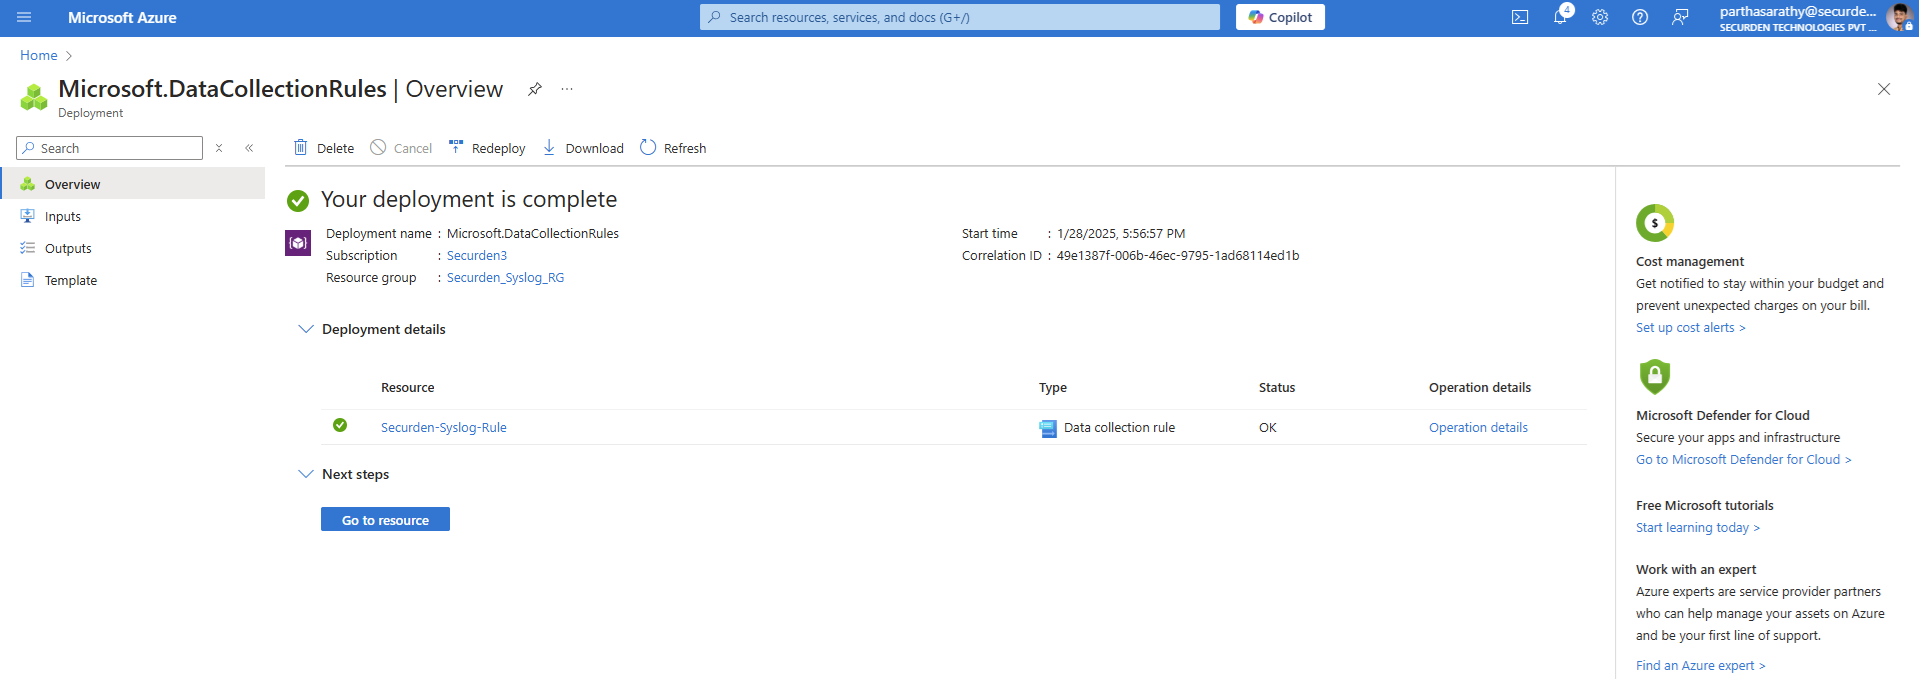
Once you have reviewed the attributes, click on Create to complete deploying the data collection rule.
Part 2: Testing the resource after setting up Log Analytics
Once the data collection rules have been configured for the Azure Log Analyzer workspace, we need to verify whether the Log Analyzer is able to connect to the virtual machine and collect log data.
Open the virtual machine and run the command shown below.
sudo systemctl status rsyslog
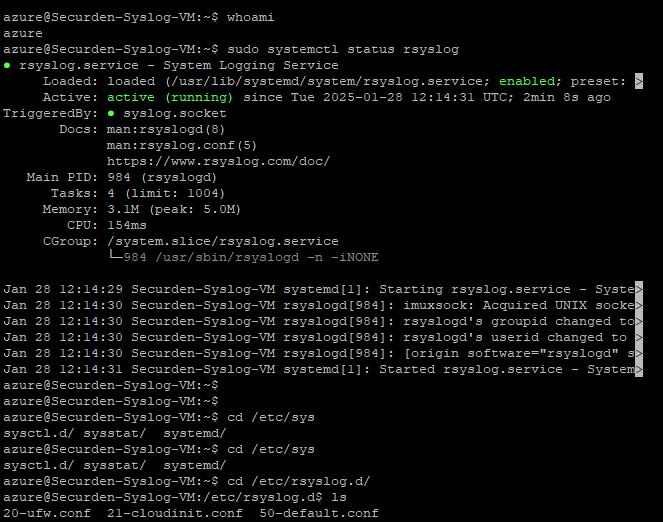
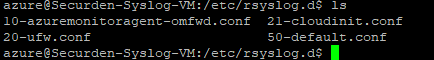
The System Logging Service will be loaded and active once the command in the previous step is executed. You can verify that the logging service and the azure agent is active and running by executing the ls command.
You can verify that Azure monitoring agent is deployed and active as the azuremonitoragent-omfwd.conf is displayed in the list of files in the rsyslog directory.
Once the status of the azure agent is verified. Run the command below.
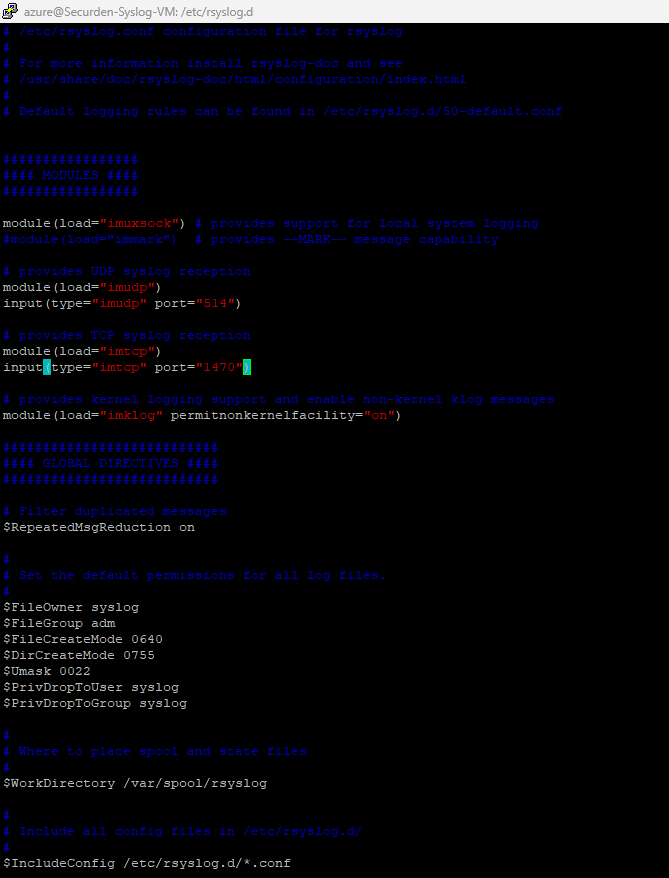
sudo vi /etc/rsyslog.conf
In the conf file, the code for functions will exist as comments. Depending on your choice of protocol, you need uncomment the code according to the guidelines given below
if you are using UDP, uncomment
module (load="imudp")
input (type=" imudo" port="514")
if you are using TCP, uncomment
module (load="imtcp")
input (type=" imtop" port="1470")
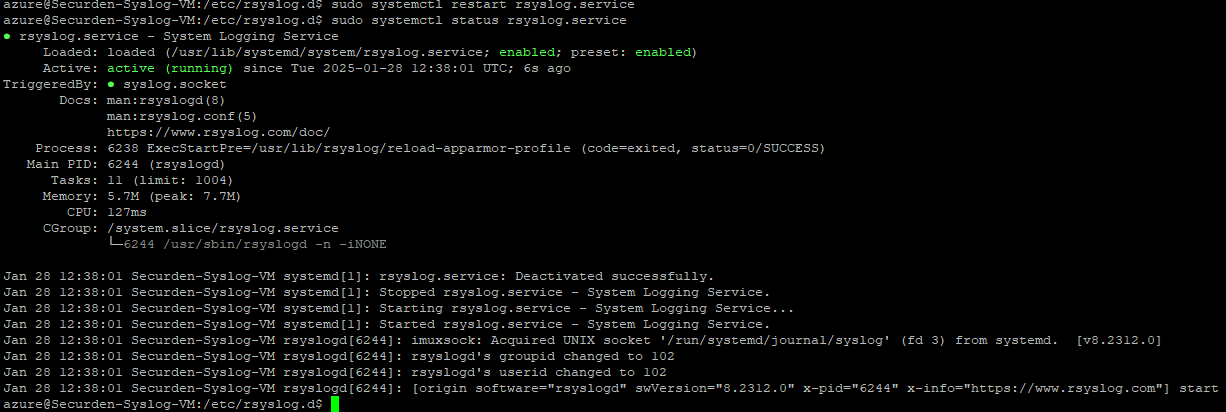
Once the changes are done, run the command below to restart the rsyslog service.
sudo systemctl restart rsyslog.service
Once the service restarts, fetch the status of rsyslog by executing the command below.
sudo systemctl status rsyslog.service
Once this step is done, you can move to the next part.
Part 3: Setting up a Securden Syslog Profile
Once the Azure resource is set up and the rsyslog settings are configured, you need to set up a Syslog profile in Securden to send the Syslog data to the Azure virtual machine.
To set up a SIEM profile in Securden for sending syslog data to the Azure VM, follow the steps below.
Go to the Admin tab and navigate to Integrations >> Syslog for SIEM.
Click on Add Syslog Configuration and provide the details about the Azure machine and the connection mode along with the Syslog server port, ticket severity type, and the Syslog format.
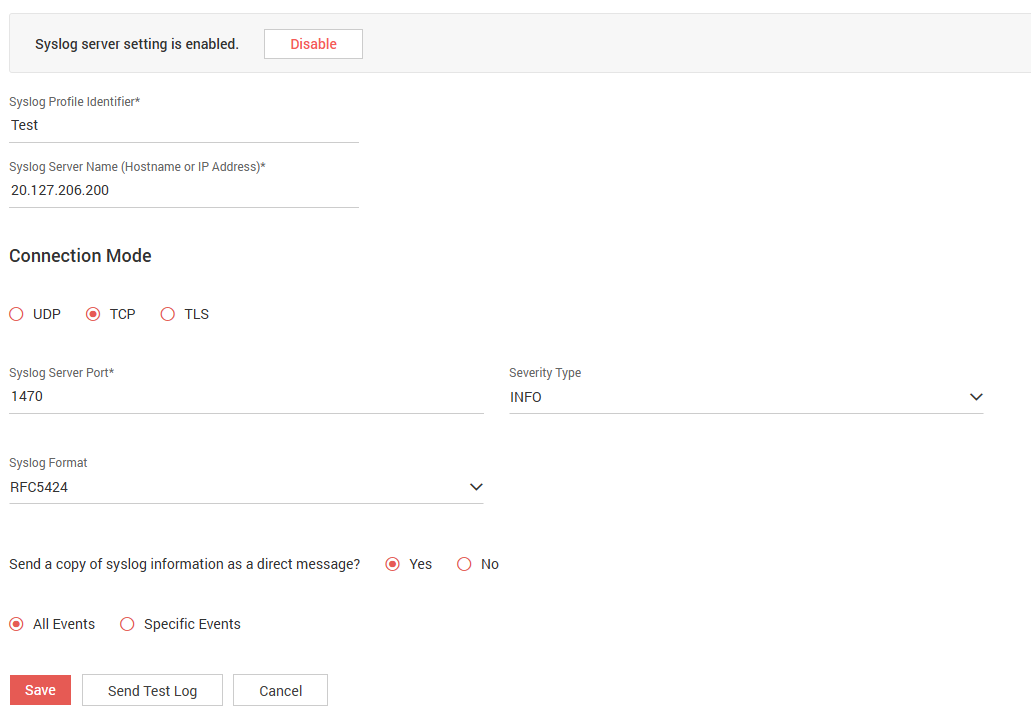
Ensure that the radio button Yes is selected for the option Send a copy of syslog information as a direct message. This is done to send the syslog information is sent as a direct message to ensure that the syslog server can capture the message easily.
You can then choose to send a syslog message for all events logged by Securden or pick and choose specific events for which you want Securden to send the Syslog data to the Azure Log Analyzer.
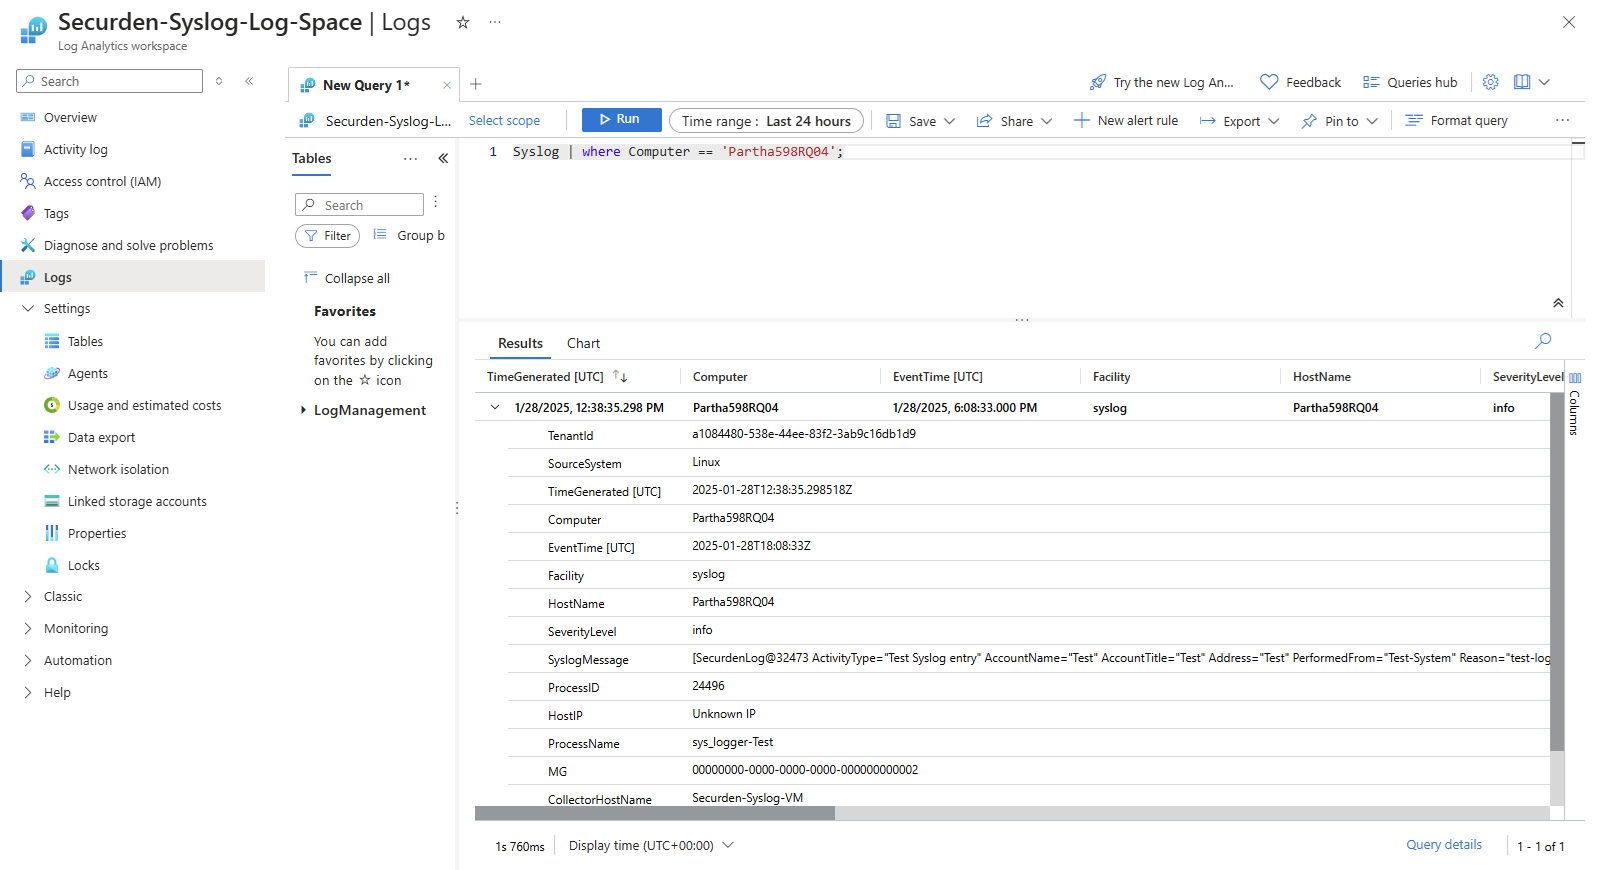
Once your preferences are selected, click on Send Test Log.
Go to the Azure Log Analyzer and check whether the test log sent from the Securden Server has been logged in Azure.
Part 4: Setting up Azure Sentinel
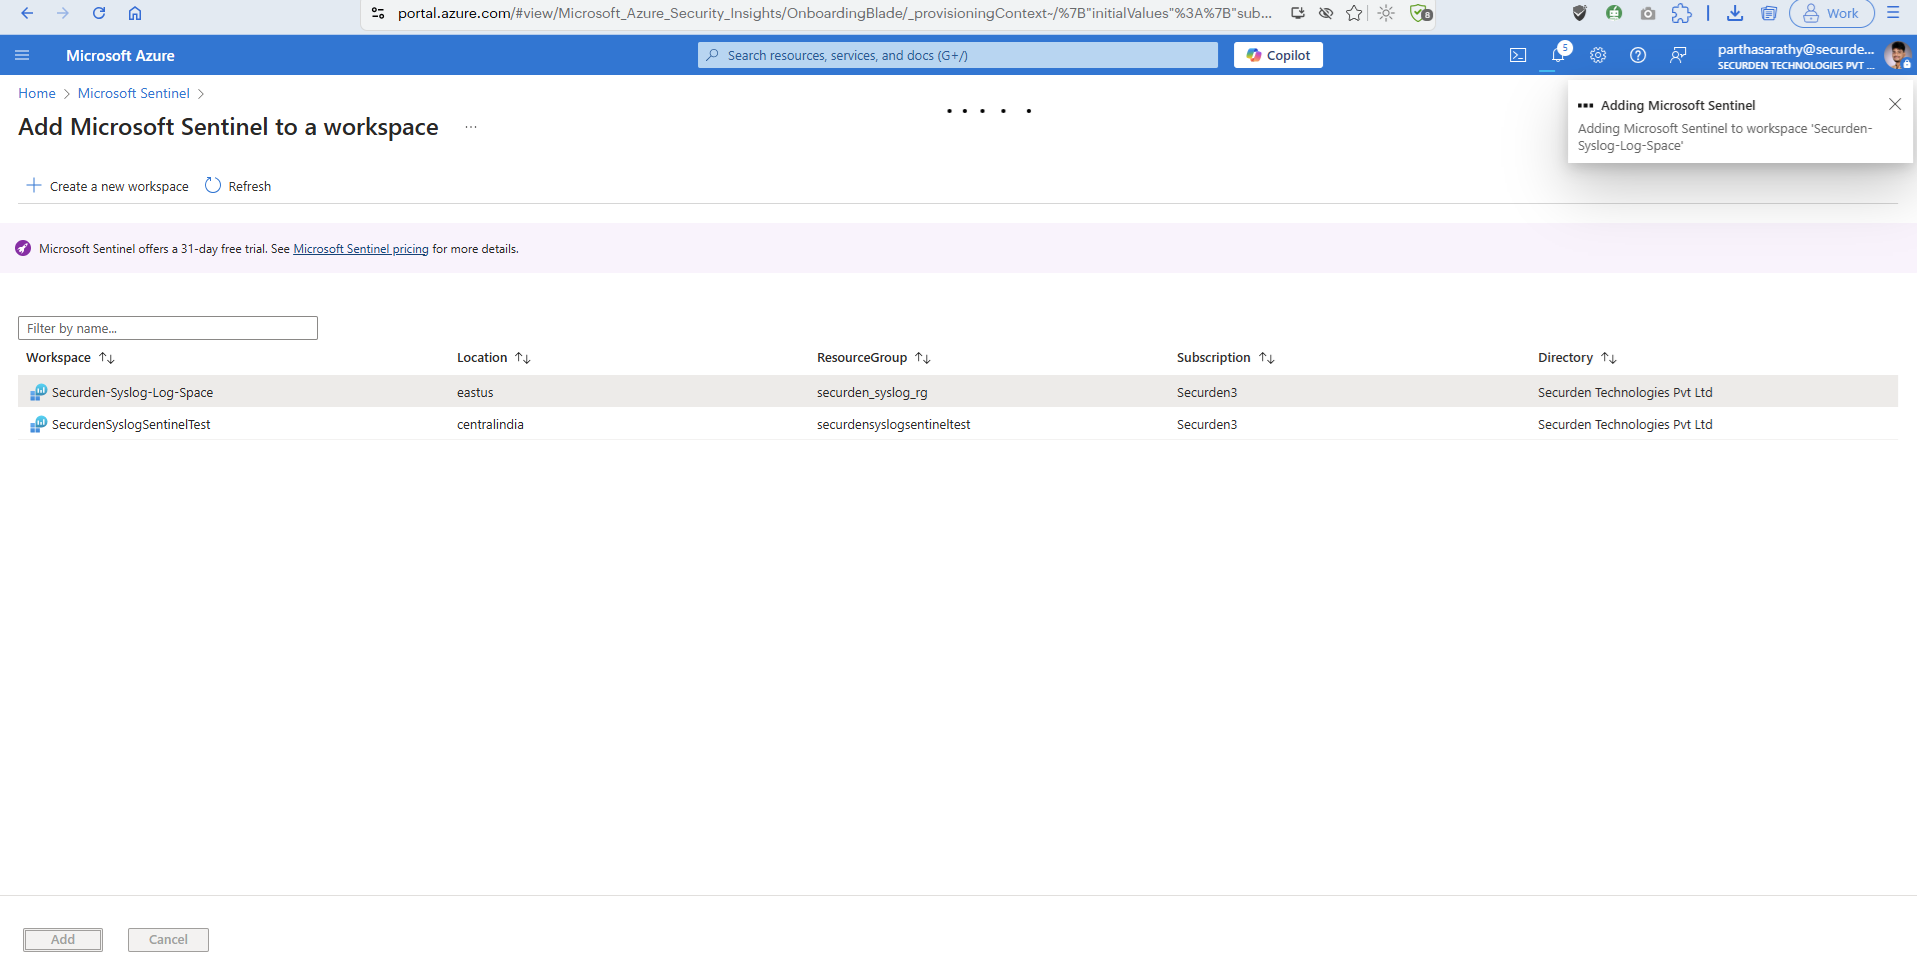
Once you have set up Azure Log Analyzer successfully, you can set up Sentinel by following the steps below.
Go to the Azure portal and search for Sentinel, click on Microsoft Sentinel and click on Create.
Here, select the workspace created in the earlier steps.
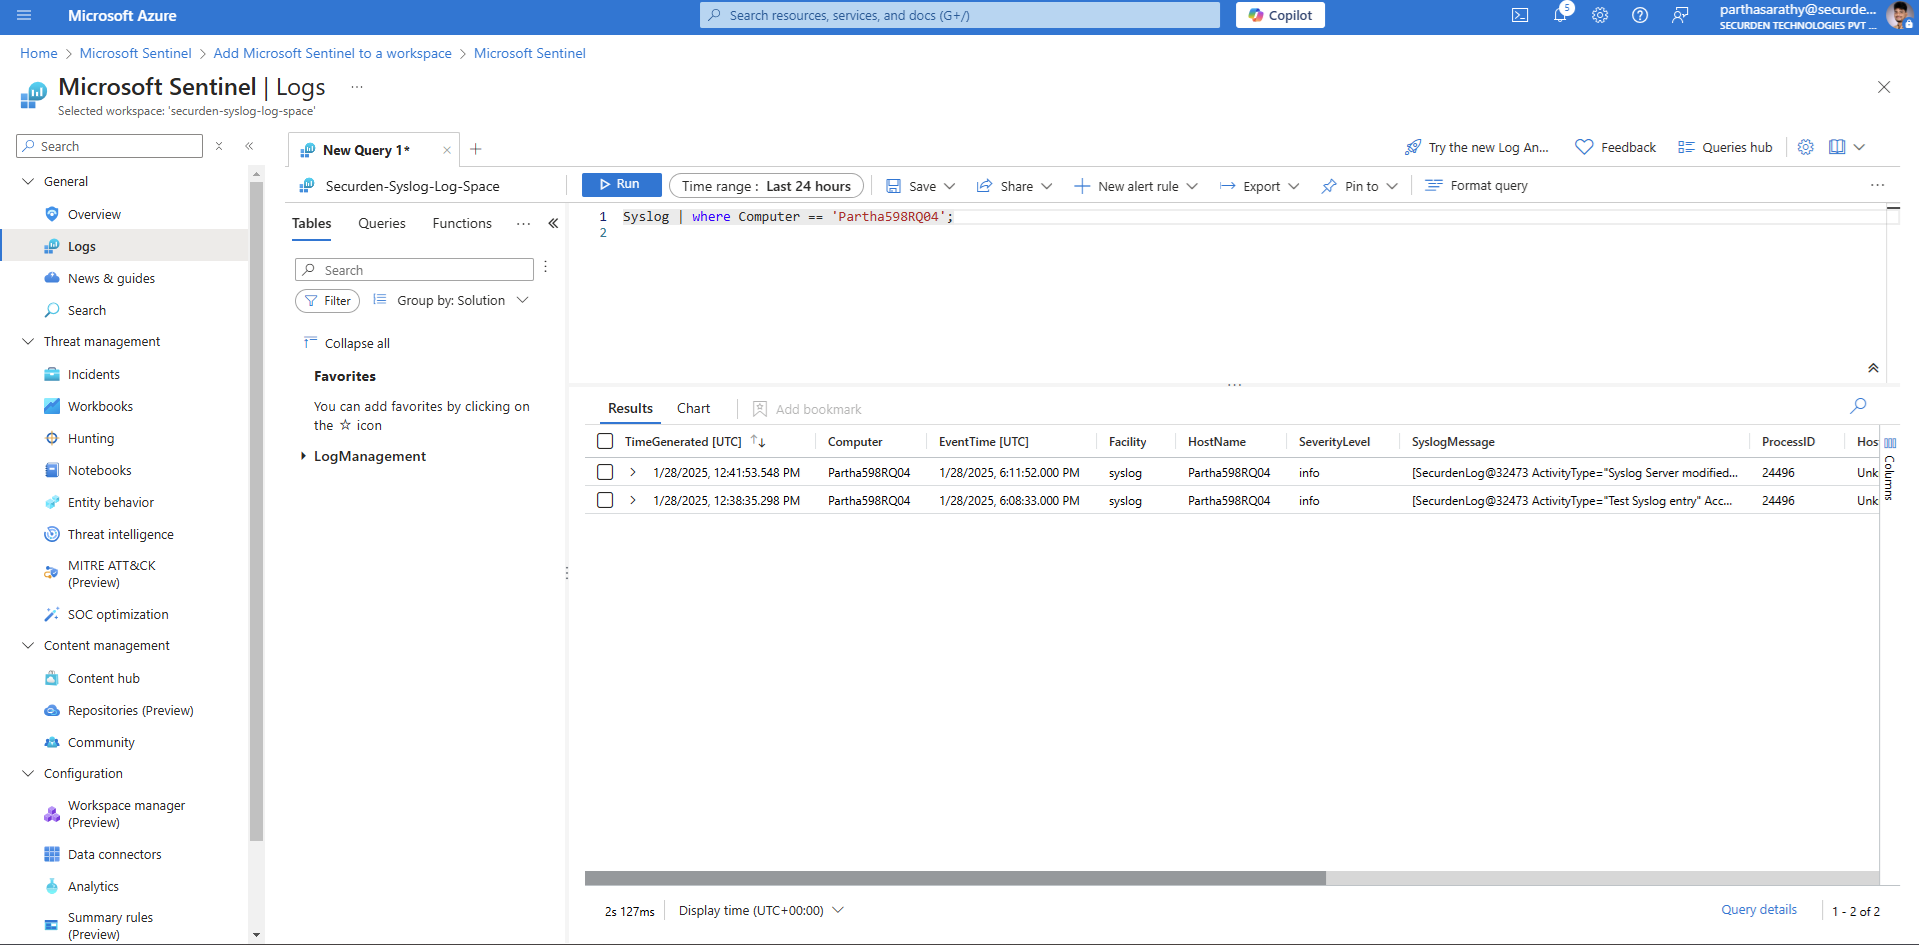
Verify whether Sentinel is receiving the logs sent from Securden.
You have successfully set up integration between Securden and the Azure Log Analyzer and Azure Sentinel.
According to the Syslog profile configured in Securden, Syslog messages will be sent to the Log Analyzer and Sentinel.
If you need further assistance in setting up this integration, write to support@securden.com

